
Get your free ebook


UX analytics is a crucial, yet often overlooked element of product development.
Think of UX analytics as an ongoing process that validates your current development efforts and helps you make a decision to pivotif necessary.
This data helps you focus on your business goals to drive analytics measurement plans, instead of tracking superficial metrics.
Having said that, it’s also important to identify the core goal of your design for the entire duration of product development. It’s the only way to meaningfully measure the design throughout its life cycle.

There are two main approaches to research: qualitative and quantitative.
Let’s talk about each of them for a second.
Qualitative data offers a direct assessment of the usability of a given product’s design.
Designers watch participants struggle with specific UI elements and infer which aspects of the design are problematic and which work well.
Session recordings are an example of qualitative research.
Quantitative data offers an indirect assessment of a given design system’s usability—in other words, we’re talking numbers.
These numbers can either:
A great example of quantitative research are Google Analytics.
The question may seem intuitive, but it is, in fact, incorrect.
The answer is: neither is better. Because that’s not what this is about.
What you should do is combine qualitative and quantitative data in order to fully understand the reasons and motivations behind the trends and behavioral patterns you’re observing.
This combination of the qualitative and quantitative approaches allows you to evaluate the performance of your UX design and your whole application in a holistic and coherent way.
Qualitative and quantitative research can be used together to further drive the direction of product development.
A good way to combine them is to use these two sets of strategic questions:
Note that each of the sets assumes a different relationship between the two types of research.
What happened? → Why did it happen?
This type of research represents a move from quantitative research to qualitative research.
Qualitative research can help you discover variables and explain why certain things happen after you discover them through statistical analysis.
Is this unusual? → Is it happening to more users?
Conversely, the second type of research is an example of moving from qualitative research to quantitative research.
Doing so allows you to discover individual trends and/or preferences, then support these claims using larger samples.
What’s the most common scenario of using UX analytics? Installing the Google Analytics Tracking Code as-is.
However, there are several problems with going about it this way:
Fortunately, there’s a better way to do this.
The rule of thumb here should always be: define your goals first, then decide on the metrics.
If you don’t define the goal clearly, it will be impossible to determine the best method of tracking the performance or user experience.
Here are more specific steps you can take:
Develop a strategy by setting up analytical goals.
Choose the right set of tools for a particular context—desktop vs. mobile users, new vs. existing users, etc.
Map the scenarios for measuring results based on existing user flows.
Create an implementation brief for the development team, then check the feasibility.
Draw conclusions and formulate new test hypotheses for further exploration.
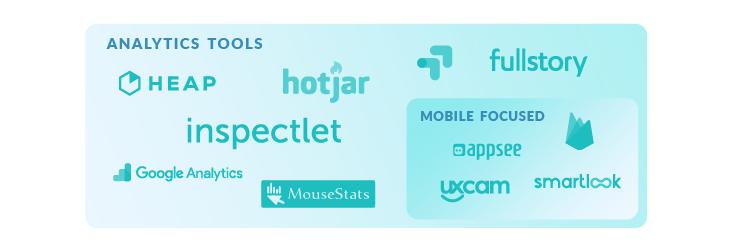
Up-to-date knowledge of various analytical tools ensures that the team's time and resources are used in the optimal way.
|
Useful functionalities |
Tools |
|
QUANTITATIVE |
|
|
Heatmaps Understand what the users want, care about, and do on your site by visually representing their clicks, taps, and scrolling behavior. |
FullStory, Hotjar, Inspectlet, Mousestats, UXCam, AppSee, Smartlook |
|
Conversion rate funnels Find the biggest opportunities for improvement and testing by identifying on which page and at which step most visitors are leaving your site. |
|
|
Form analysis Improve online form completion rates by discovering when and why your visitors abandon your forms. |
|
|
Feedback pools Understand what your web and mobile visitors want and what's preventing them from achieving it by targeting time- or event-based questions. |
|
|
Surveys Collect deeper insights from your customers as soon as they convert, or insights from visitors before they leave, using responsive surveys that work on any device. |
|
|
A/B testing It lets you compare the performance of two versions of a page by showing half your visitors one version of your site, and the other half the second. |
|
|
User flow / Behavior reports This feature gives you a big picture of how users are navigating within your app. With this tool, you’ll quickly understand where the majority of your users are making their way between your different screens. |
|
|
Basic numerical data Traffic analysis, user segmentation, and page view analysis are all basic sources of numerical data for your audience. |
|
|
QUALITATIVE |
|
|
User recordings Identify usability issues by watching recordings of real visitors on your site as they click, tap, move their cursor and navigate across pages. |
FullStory, Hotjar, Inspectlet, Mousestats, UXCam, AppSee, Smartlook |
|
Open-ended feedback Give your visitors an easy way to leave instant written feedback on your website or app. See what people love and hate, identify issues, and find opportunities for growth. |
|
|
Launching a New Feature |
Addressing Feedback |
|
Approach |
Quantitative Research → Qualitative Research What happened? → Why did it happen? |
Qualitative Research → Quantitative Research This is unusual? → Is it happening to more users? |
|
Tools |
Google Analytics → FullStory |
Mousestats → AppSee |
|
Primary Trigger |
A statistical analysis (conversion funnel) showed us that users are abandoning the Apple Pay payment option after an initial decision of using this payment method. |
An open-ended feedback insight within the app suggested that it is not entirely clear how to proceed with a designed primary user flow. |
|
Deeper Analysis |
Video recording of this particular screen revealed a bugged expansion panel that should contain a summary of the payment option description. |
User flow analysis revealed that 84% of the active users from the previous month were constantly moving back and forth between the two steps of an action; they were stuck. |
|
Problem Identified |
Users were not able to obtain a crucial information about this payment method and therefore decided to move forward with more familiar methods. |
Users were confused by the coloring of the primary buttons. Even though they aligned with the brand’s Corporate Identity, they were indicating a danger or warning (red color) based on color psychology. |
|
Outcome |
Removing a simple bug increased the adaptation of this method by 900% in the upcoming month. |
Changing the color and slightly tweaking the labels within the buttons decreased the back and forth movement by 54%. |
The potential of UX analytics does not end there. Here are a few more questions that you can answer by implementing some of the tools and methods above:
If you’d like us to dig deeper into any of those, let us know in the comments!
In order to achieve meaningful measurement of UX analytics, you shouldn’t focus on goals that are easy to track, but rather goals that are:
Should you fail to consider these deeper goals when selecting your metrics and reporting on your data, you risk overlooking crucial statistics that are imperative to effective Product Design.
Thanks for reading our article. If you found this helpful, you should also:
And if you're looking for excellent design and analytics for your product, why not hire our Product Design team for the task?