


Introduction
A single dbt run tells you what happened this time. It shows which models ran, how long they took, and which tests failed or returned warnings.
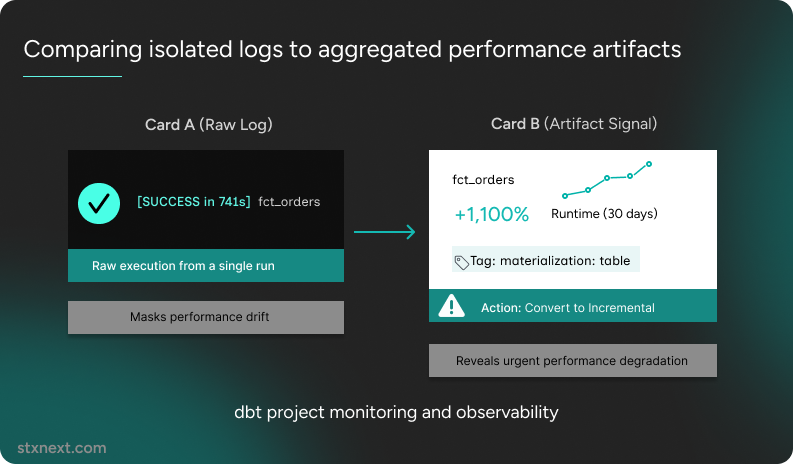
What it can’t show on its own is whether the same model has been getting slower for weeks, whether failures keep returning at a particular time, or whether the overall reliability of the project is improving or getting worse.
That is where dbt artifacts become more useful. Files such as manifest.json and run_results.json capture the project structure and the results of individual dbt invocations. When the dbt_artifacts package loads their contents into warehouse tables and retains them across runs, they become a historical dataset for monitoring performance, test outcomes, execution trends, and project reliability.
This article explains how teams can use the dbt_artifacts package to turn dbt artifact files into an observability layer, detect performance degradation, and identify areas that may need engineering attention before small issues become recurring problems.
What dbt artifacts actually capture
Every dbt run leaves metadata in the target folder. Two files are especially useful here: manifest.json and run_results.json.
manifest.json describes the project graph: models, sources, tests, dependencies, configurations, and the relationships between nodes. run_results.json captures the outcome of a specific invocation, including what executed, how long it took, and the status returned by each node.
On their own, these files provide a snapshot of one project state or one run. The more useful pattern begins when their contents are retained across multiple invocations.
The dbt_artifacts package loads this metadata into warehouse tables after each run. That turns isolated JSON files into a historical dataset teams can query, aggregate, and compare over time.
Instead of showing only what happened in the latest run, artifact history can reveal which models are becoming slower, which failures keep returning, and which parts of the DAG repeatedly need attention. That’s what makes it a practical foundation for dbt project observability.
From run results to project signals
A single dbt run is useful, but it’s easy to read too much into it. One failed test, one slow model, one noisy run: by itself, that’s not much of a story.
It gets more interesting when you can compare runs. Then you start seeing which failures keep coming back, which models are actually getting slower, and which parts of the DAG repeatedly show signs of instability.
That’s where artifact data earns its keep.
Collected across runs, it gives the team a better feel for how the project behaves. Not just what failed today, but what keeps getting slower, noisier, less reliable, or more resource-intensive over time.
Turning artifacts into observability signals
Once artifact data lands in warehouse tables, you can start treating it like any other operational dataset. Query it, aggregate it, compare runs, build dashboards if you need them. And yes, most data teams eventually do.
Two tables are especially useful: model_executions and test_executions. They contain the kind of metadata you actually want for dbt observability: invocation IDs, node IDs, statuses, execution times, materialization types, failures, and warnings.
That gives you a base for a few practical checks.
Monitoring model performance over time
Performance is usually the easiest place to start.
Execution-time trends provide more context than a single runtime measurement. When a model begins to move away from its normal baseline, it may indicate emerging performance degradation.
A model may take five minutes every day and still behave predictably. Another may grow from one minute to five minutes over several weeks, or spike every Friday at noon. Those changes may indicate increasing data volume, inefficient transformations, warehouse contention, or another operational issue worth investigating.
Artifact history shows which models take the longest, how execution time changes across runs, and where performance begins to drift from the usual pattern. Recurring slowdowns and steady increases in runtime are the signals most likely to deserve closer investigation.
Maybe the data volume changed or the model itself needs work. Or maybe it’s just one of those parts of the project everyone knows is slow but nobody has touched yet.
Building cost awareness from execution metadata
Runtime isn’t the same as cloud cost, but it’s often a good place to start looking.
If project runs are getting heavier or taking longer over time, execution metadata helps you see where the additional weight is coming from. You may still need warehouse-level data to calculate actual spend, but artifact history can point you to the models and invocations worth investigating first.
Tracking data quality as a trend, not a snapshot
A single test result tells you what happened in the current run. That’s useful, but it doesn’t tell you whether the same issue keeps coming back.
And that distinction matters.
If a test fails once, you fix it. If it fails every few days, the problem may be bigger than the test result itself. It could be ownership, source reliability, a weak data contract, model design, or simply a test the team stopped trusting a long time ago.
Artifact-based monitoring helps you see that pattern. It moves the conversation from “did the build pass?” to “which parts of the project are getting noisier or harder to trust?”
That’s a much better engineering conversation.
Measuring coverage and reliability
Artifacts also let you calculate practical indicators like daily success rate, fail or warn rate, and test coverage.
None of these numbers should be treated as the full truth. High test coverage doesn’t mean the right logic is protected and a low warning rate doesn’t prove the project is healthy. But these metrics are still useful because they make risk easier to see.
Test coverage is a good example. If only four out of fifteen models have tests, the number isn’t the whole story. Maybe those tests are great, maybe they barely check anything useful. But still, it’s hard to ignore the signal: most of the project is running without much of a safety net.
And that’s worth knowing before something breaks.
What artifact history reveals over time
Once artifact history is available in the warehouse, the team can start asking more useful questions:
- Which models have become slower over the last seven or thirty days?
- Do execution-time spikes happen at recurring hours or on particular days?
- Which models consistently act as bottlenecks?
- Is the daily success rate improving or declining?
- Which tests repeatedly fail or return warnings?
- How much of the project is covered by at least one test?
These are simple questions, but they are difficult to answer from the latest run alone.
Why invocation ID matters
invocation_id is easy to overlook, but it’s one of the fields that makes artifact data much more useful.
It ties together everything that happened during one dbt command. If one dbt build runs a set of models and tests, you don’t have to analyze those records as separate node-level events – you can look at the whole run as one operational event.
That matters when you want to understand run-level behavior: which builds were unusually slow, resource-intensive, unstable, or noisy, and whether that was a one-off or part of a recurring pattern.
In other words, invocation_id is what lets you move from “this model failed” to “this build behaved differently than usual.”
Keeping artifact data separate from business models
One practical detail is worth keeping in mind: put artifact-derived tables in a separate schema.
Artifact data is operational metadata. It tells you what ran, what failed, what warned, how long things took, and which invocation they belonged to. Useful, yes. Business-facing, no.
So don’t mix it with the business model layer.
Keeping it separate makes the project easier to reason about. Business models stay focused on business logic. Artifact tables get their own space for operational monitoring, trend analysis, and project health checks.
It’s a small design choice, but exactly the kind of boring boundary you’re happy to have later.
Signals your usual dashboards may miss
You probably already have dashboards for the warehouse, orchestrator, and infrastructure. Good. Keep them. They are useful.
But they usually don’t know much about your dbt graph.
They may tell you that a job took longer, failed, or consumed more resources. What they won’t always show is that the same warning keeps coming from one part of the DAG, that a model has been getting a little slower every week, or that a supposedly minor area of the project has almost no test coverage.
dbt artifacts add that missing layer of context. They connect run behavior with the actual transformation graph and testing layer, which is where many of the more interesting problems start.
And those problems are rarely dramatic at first. They usually look like small annoyances: a warning everyone ignores, a test people rerun instead of fixing, a model that is “just slow sometimes.”
You know the type.
The trouble is that small signals like this have a habit of becoming normal. And once they become normal, the team stops treating them as signals at all.
Artifact data helps surface those patterns early. It makes those weak signals easier to see before they turn into the kind of issue that sends everyone digging through logs on a Friday afternoon.
What artifacts can’t tell you on their own
Artifacts are useful, but they aren’t a senior engineer in JSON form.
A slow model isn’t automatically a bad model. High test coverage doesn’t mean the right things are tested. A scary-looking warning rate may be less important than one failure in a critical domain.
So yes, collect the metadata. Query it, chart it, compare it across runs. Just don’t confuse the signal with the diagnosis.
Artifacts are best used as a way to focus engineering attention, not as a replacement for architecture, domain knowledge, or judgment.
From observability to proactive action
The obvious next step isn’t “let’s build one more dashboard.” Famous last words in every data team.
The more useful question is whether this metadata can help the team decide where to look next.
If artifact history shows which builds were slow, which tests returned warnings, which models failed, and which parts of the DAG keep causing trouble, it can help flag the areas that deserve attention.
That might mean targeted alerts, recommendations, or workflow automation based on dbt’s own run history. Nothing magical. Just a system saying: this model has been getting slower, this test is becoming noise, this part of the graph keeps appearing in failed or unusually slow runs.
That’s the kind of observability teams actually need. Not just “here is what happened,” but “this is probably where you should look first.”
The goal isn’t to automate the diagnosis, but to make recurring signals harder to miss.
Final thoughts
dbt artifacts are easy to overlook because dbt generates them automatically. dbt artifacts are easy to overlook because dbt generates them automatically. They appear in the target/ folder with each run, yet the metadata they contain is often used only for that moment rather than analyzed over time.
But a single artifact only describes one project state or one invocation. Store that metadata across runs, and it becomes a history of how the dbt project behaves.
That history can show which models are becoming slower, where execution-time spikes keep returning, which tests repeatedly fail or warn, how success rates change, and how much of the project is covered by tests. It doesn’t provide the diagnosis by itself, but it makes patterns and weak signals much easier to identify.
That’s the practical value of the dbt_artifacts package. It turns metadata that would otherwise remain tied to individual runs into an operational dataset for monitoring performance, data quality, and project reliability over time.
The artifacts are already there. The useful step is to retain enough history to see what one run cannot show.


