

Data Visualization & Dashboard Design Services
Stop building dashboards nobody uses & start engineering decisions
Key signals often get buried across dense tables and disconnected charts. STX Next combines data visualization and experience design with data and cloud engineering to build executive dashboards, control rooms, and data-intensive interfaces people can act on.

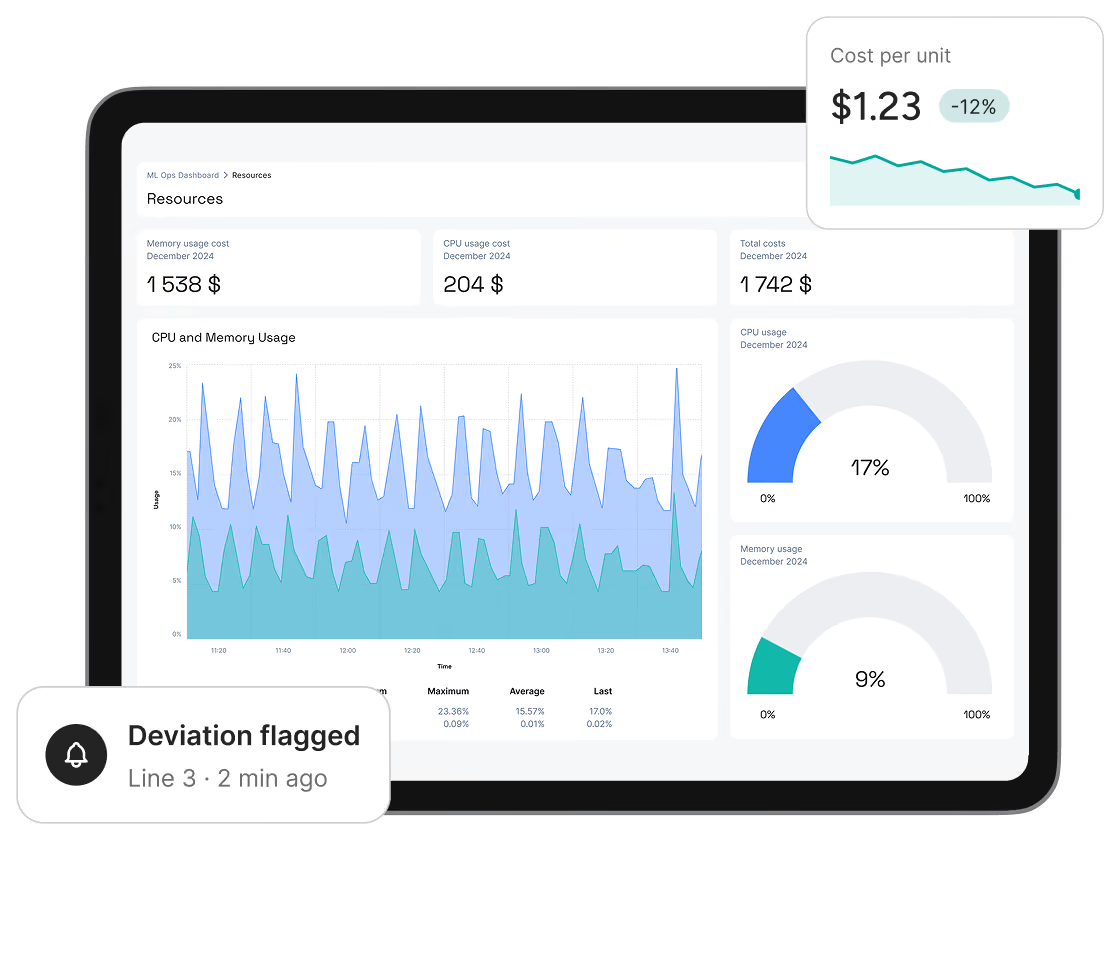








Where Data Visualization Meets Data Engineering
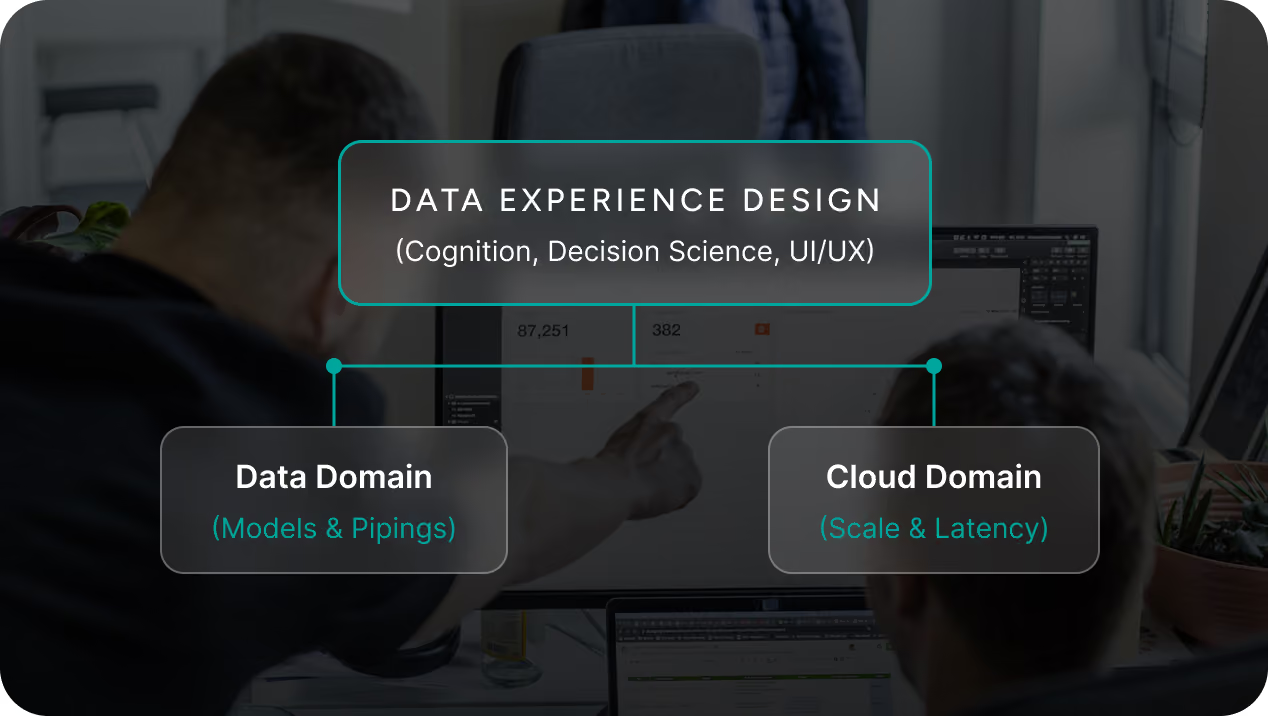
Start with the decision experience, not the backend. Data Experience Design defines how information should be structured and interpreted first, while data and cloud engineering provide the models, pipelines, scale, and latency to support it.

Our Services
We help you define the decision flow, design the interface, build the supporting data layer, and deploy it within your existing environment.
Data Visualization Strategy & Decision Audit
Map decision workflows, identify where users struggle to interpret the data, and define the information hierarchy before development begins.
Deliverables: Decision workflow audit, KPI dashboard wireframes, KPI and information hierarchy
Custom Dashboard & Control Room Development
Build executive control rooms and operational interfaces for complex, high-volume data environments.
Deliverables: Executive interfaces, pre-aggregated data models, cloud and pipeline integration
Native BI Dashboard Redesign
Modernize existing BI and analytics environments to reduce visual clutter, improve usability, and address performance issues without introducing a new platform.
Deliverables: Redesigned BI layouts, semantic and data model improvements, query and caching optimization
For platform-specific implementation and optimization, explore our Power BI consulting services and Tableau consulting services.
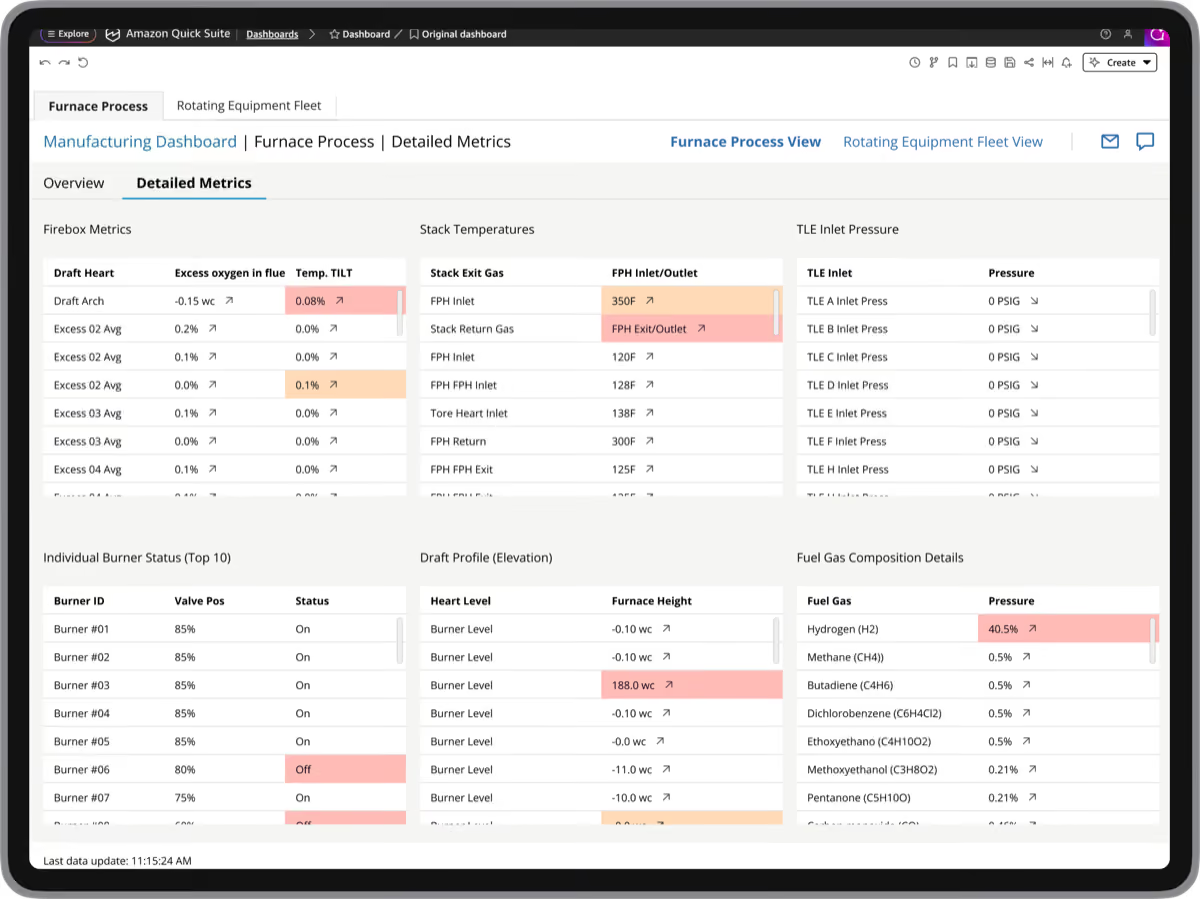
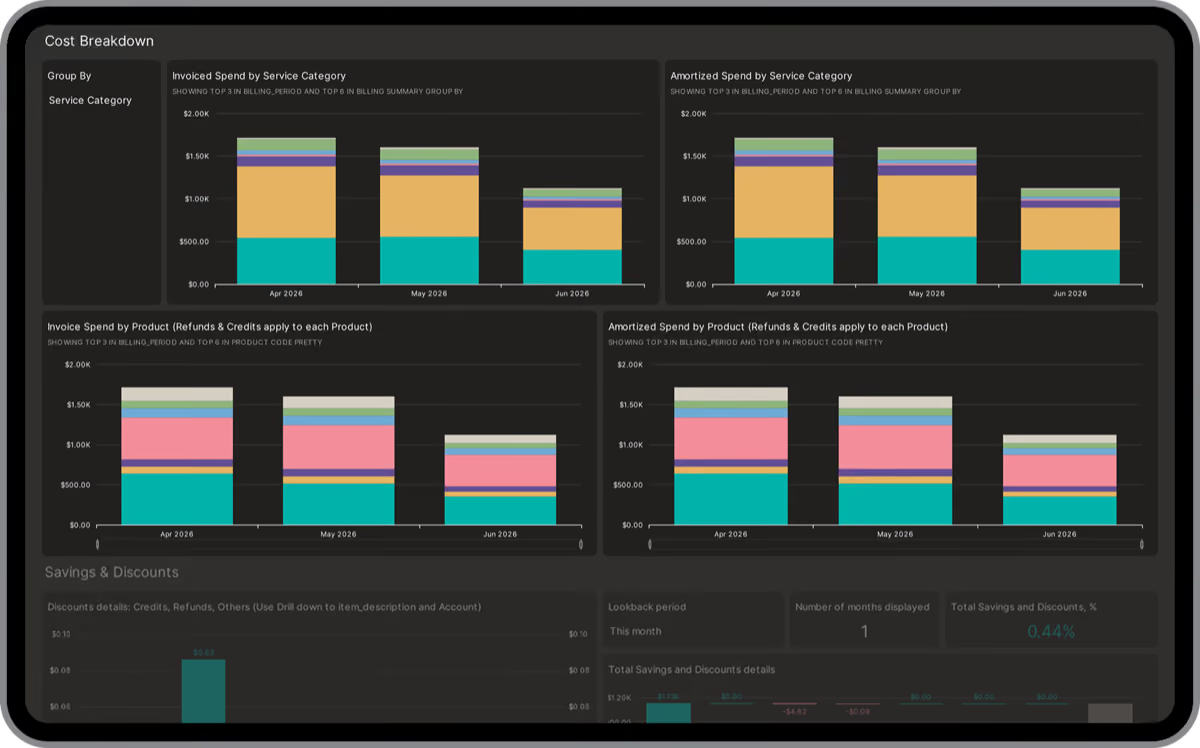
Data Visualization for Complex Operational Environments
We prioritize key signals, make anomalies easier to spot, and design around the constraints of the data and cloud environment.
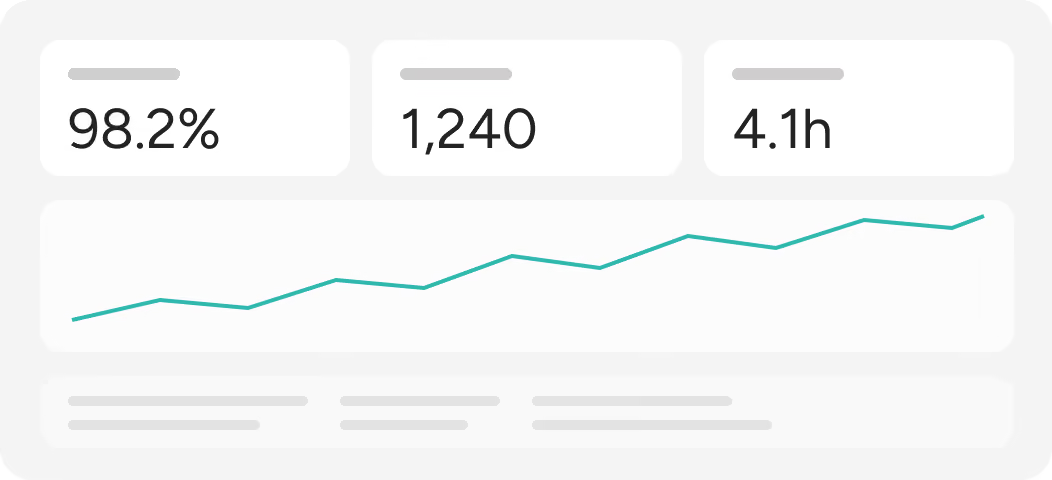
Information Hierarchy
Structure layouts top-down, from high-level situational metrics to the detail needed for root-cause analysis.
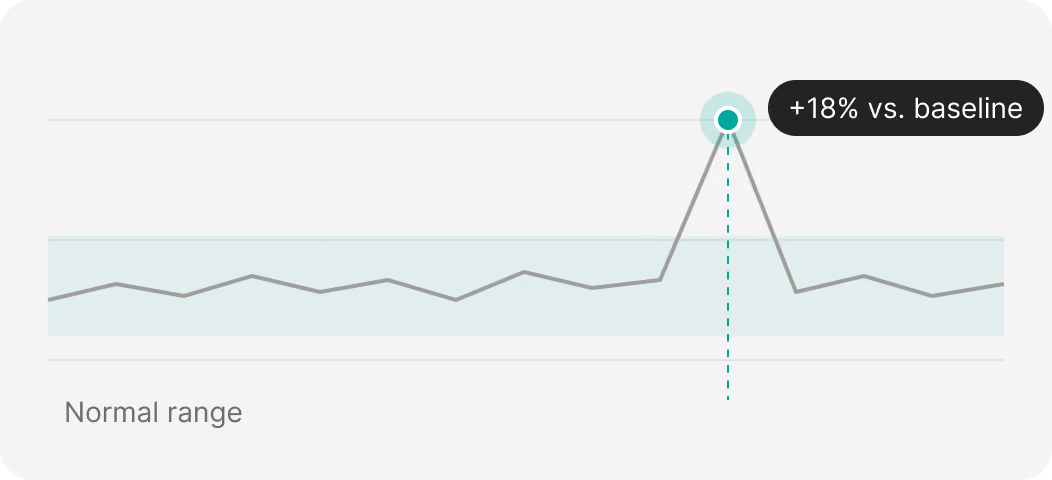
Exception Visibility
Highlight anomalies, outlier trends, and operational drift at a glance instead of leaving them buried across multiple charts.
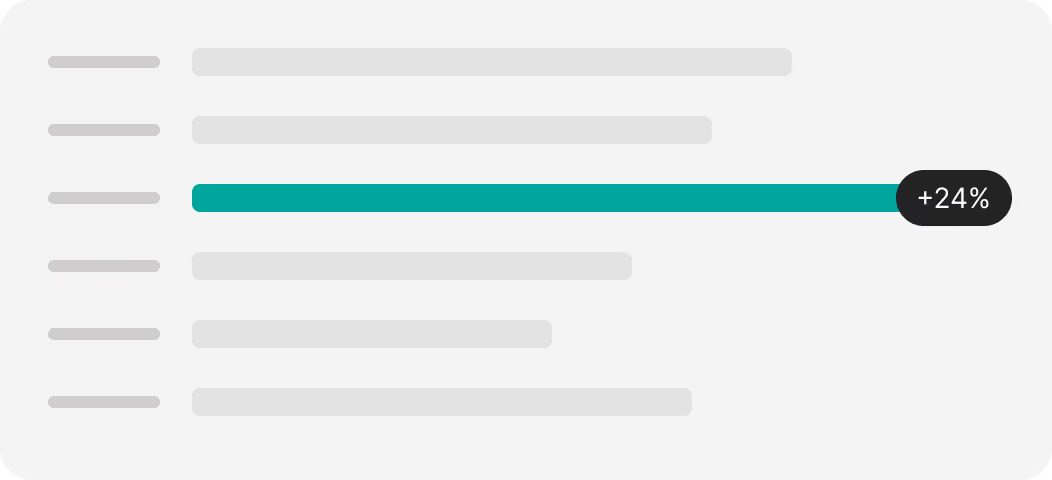
Contextual Visual Prioritization
Reserve color and directional cues for variance, exceptions, and operational or financial changes that require attention.
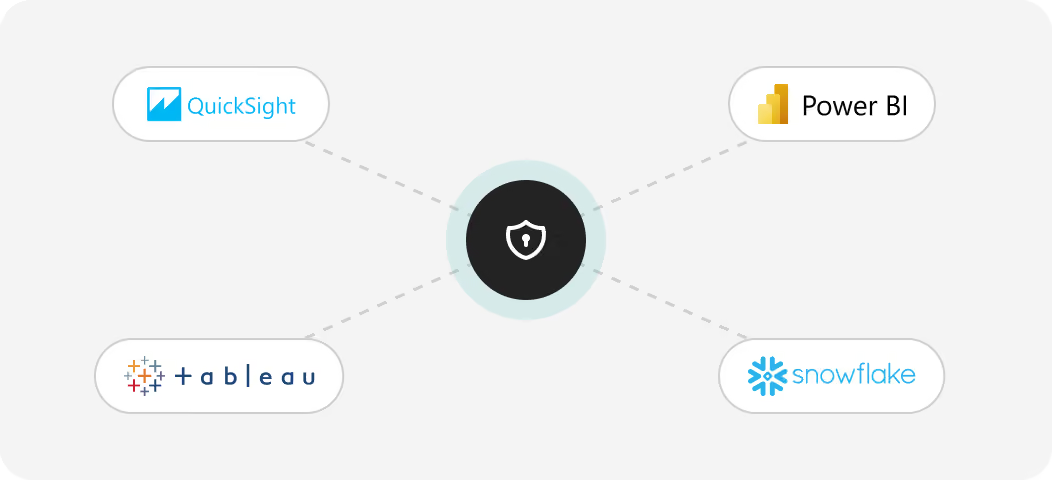
Native Enterprise Integration
Build directly inside your existing BI and cloud stack, with governance and single sign-on integrated from the start.
Case Studies in Data Visualization
See how the approach has been applied across financial analytics, cloud cost management, manufacturing operations, and industrial monitoring.
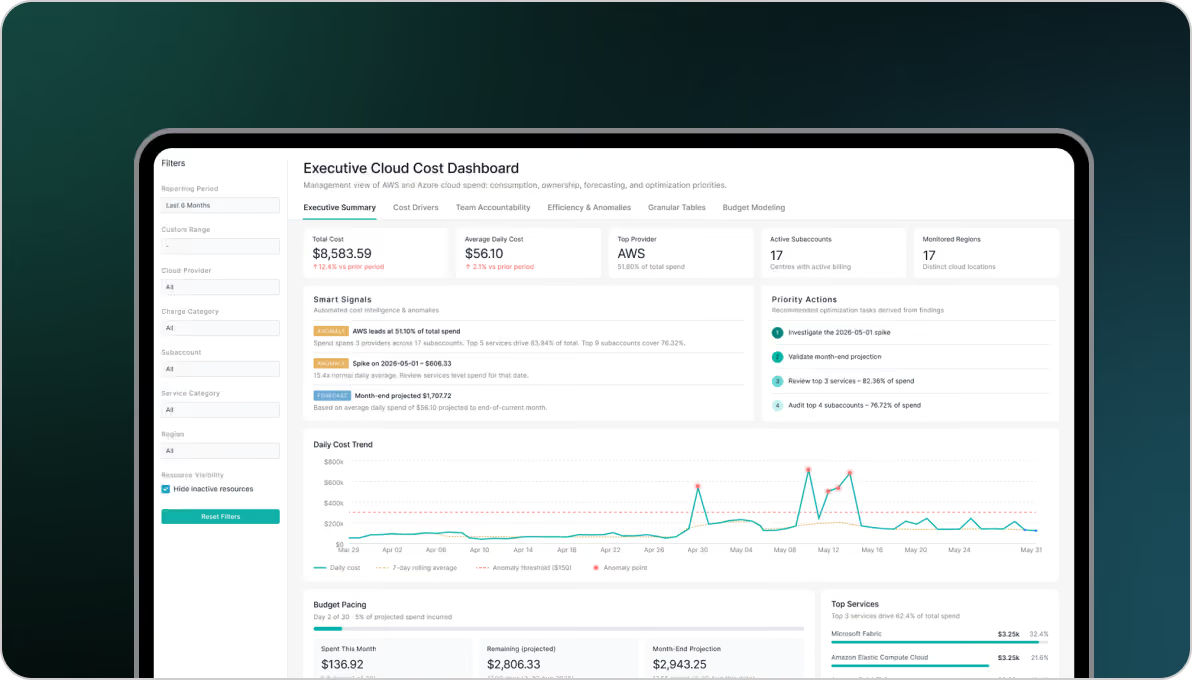
Financial Dashboards
Enterprise multi-account structures lock financial visibility into technical silos, forcing leadership to decipher raw, unamortized billing logs.
We designed the interface to separate normal operational growth from cloud waste, isolate software marketplace commitments, and bring spending trends into a single view.
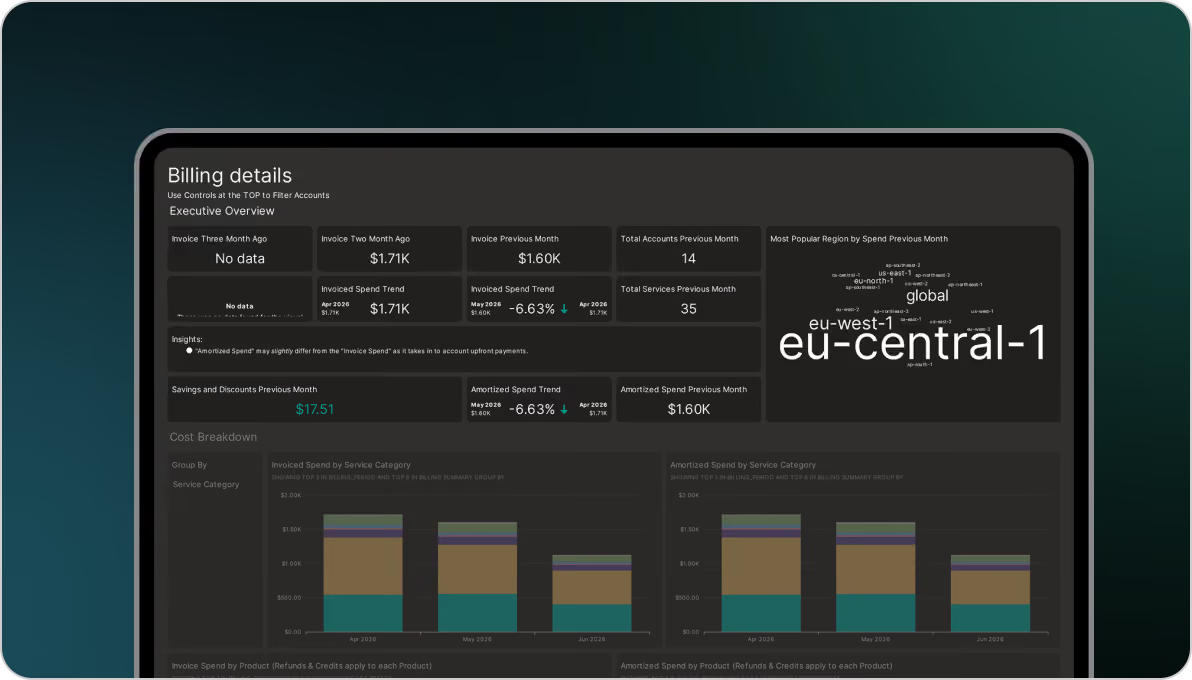
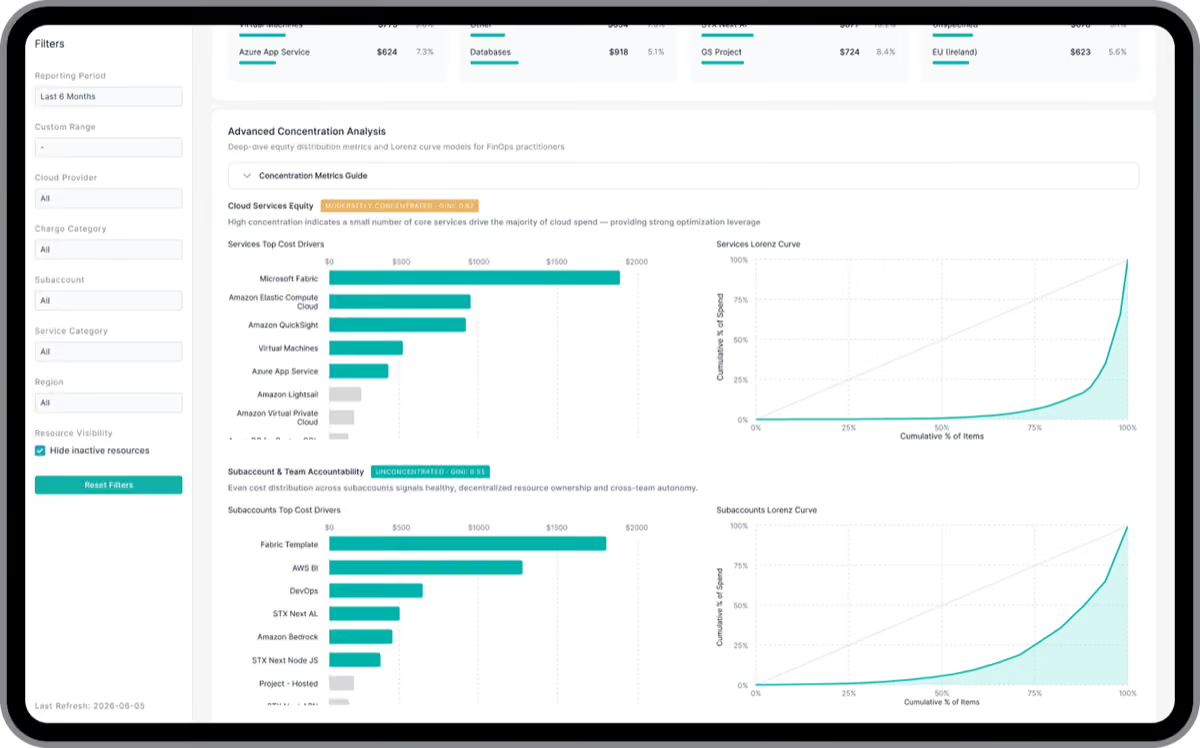
Multi-Cloud Billing Analytics
Fragmented multi-cloud infrastructure, vanity metrics, and overly complex interfaces made cost optimization difficult.
Working with FinOps experts, we translated millions of billing records into allocation matrices and concentration curves to make cost patterns easier to interpret.
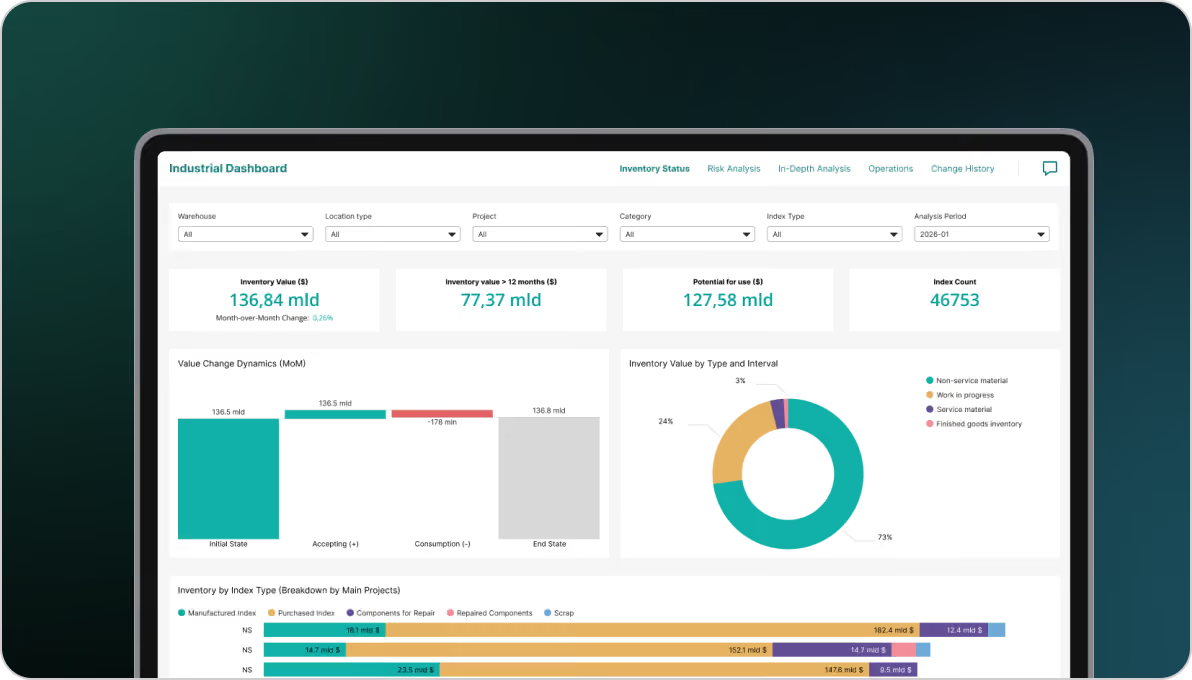
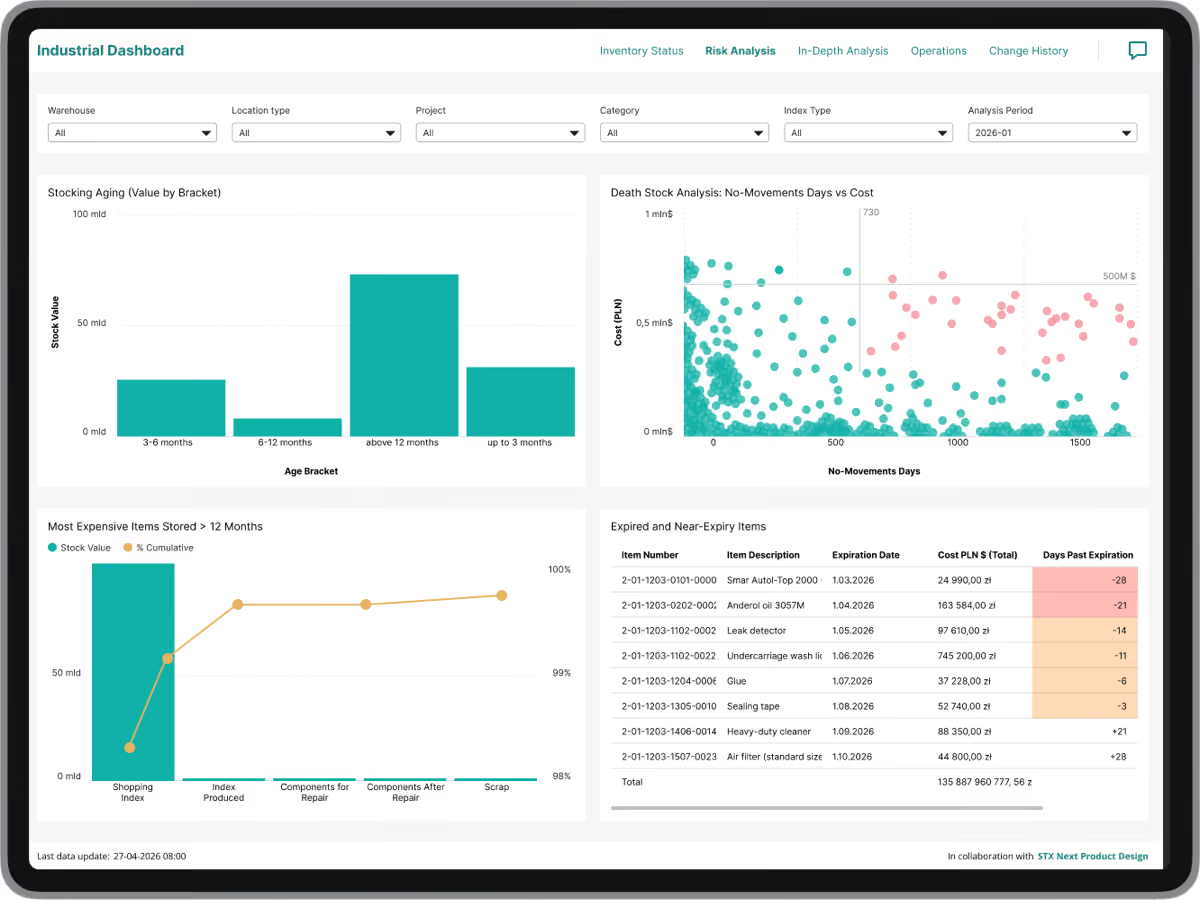
Supply Chain Dashboards
Fragmented inventory metrics and blind spots made it difficult to verify production readiness and understand where capital was tied up.
We connected raw material inventory with specific production projects in a unified view, helping planners identify stock shortages, production gaps, and material availability more quickly.
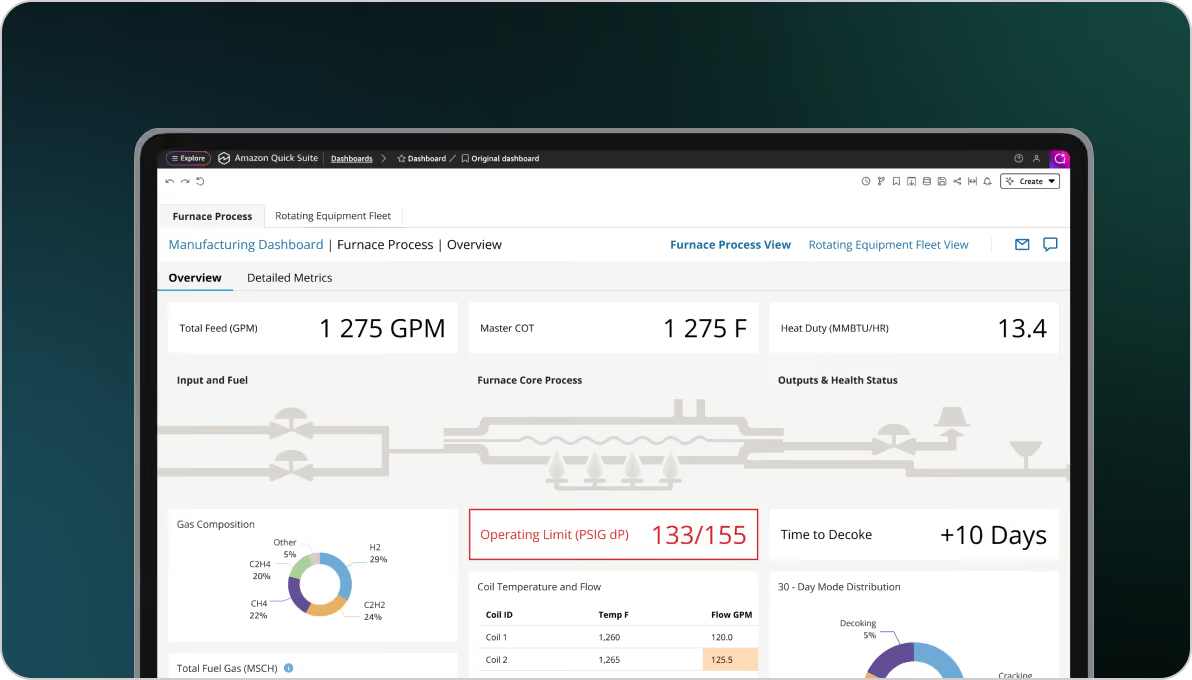
Manufacturing Monitoring
Plant operators had to monitor large volumes of real-time data in dashboards where routine readings and warnings competed for attention, making true anomalies harder to identify.
We introduced a strict visual hierarchy, de-emphasized normal operating states, and reserved color for leading indicators and intervention areas so deviations were easier to spot.
Why Enterprise Teams Choose STX Next
Data Experience Design leads the interface strategy, while data and cloud engineering provide the technical foundation behind it.

Design, Data, and Cloud in One Approach
The interface is designed together with the models, pipelines, and infrastructure needed to support it.

Native Stack Integration
We work within your existing Power BI, QuickSight, Tableau, Snowflake, Databricks, or cloud environment.

Performance Built Into the Architecture
Pre-aggregation, query caching, pipelines, and cloud infrastructure are configured around the validated interface.
Enterprise Governance Included
Governance, single sign-on, and existing infrastructure requirements are part of the implementation.

From Decision Mapping to Production Deployment
We test the interface logic before backend implementation, then bring data and cloud engineering in around the validated experience.
Make Complex Operational Data Easier to Use
We redesign overloaded interfaces and the data architecture behind them to make critical information easier to interpret and act on.

Frequently Asked Questions
Can you redesign our existing dashboards without changing our BI platform?
Yes. We work within existing Power BI, QuickSight, Tableau, and other BI environments. The work can focus on the interface itself or include changes to the supporting data models, queries, caching, and cloud setup where they affect usability or performance.
Why do technically accurate dashboards still fail to support decisions?
Accuracy alone does not determine usability. Dense data grids, weak information hierarchy, and excessive visual noise can leave users doing too much interpretation themselves instead of seeing the most important signals first.
Why are our dashboards slow, and do we need to change the data model?
Slow performance can come from the visual layer, query design, data model, data volume, or the infrastructure behind it. We assess the interface and the supporting architecture together to identify where changes are needed.
Why involve data and cloud engineers in dashboard design?
The interface and backend affect each other. Complex visuals can create slow queries and poor responsiveness if the underlying models, caching, and infrastructure are not designed around how the interface will be used.
Can you work within our existing BI stack?
Yes. The approach is designed for existing environments such as Power BI, QuickSight, Tableau, Snowflake, Databricks, AWS, Azure, and Google Cloud.
How do you reduce visual overload in operational dashboards?
By using top-down information hierarchy, selective color, directional indicators, and anomaly-focused views so deviations stand out without adding more charts.
Can this approach support high-volume operational data?
Yes. The delivery process includes pre-aggregation, query caching, pipeline alignment, and cloud architecture to support the required scale and latency.


ul. Mostowa 38
61-854 Poznań
Poland
C.11 310 Col. Santa Gertrudis Copo
Merida, 97305
Mexico
10 York Rd
London SE1 7ND
United Kingdom
c/o Rödl RAe, Taunus Tower, Mergenthalerallee 73-75
65760 Eschborn
Germany
City Place 1401 Lake Plaza Dr, Ste. 200
Spring, TX 77389
United States