

At first, this looked like a typical predictive maintenance project
We learned this the hard way while working with a major chemical company. The original task was simple enough: predict equipment failures before they happen. But once we got into the data, it became clear that the project had much less to do with model selection than anyone expected.
What started as a “build a model to predict equipment failures” request turned into a full data platform transformation. The real effort went into making the data usable, connecting it to how the equipment actually behaved, and building something that could still be trusted after deployment.
As the project unfolded, it exposed the challenges that often make predictive maintenance initiatives stall in practice.
Top predictive maintenance challenges in real-world projects: Based on the industrial case study
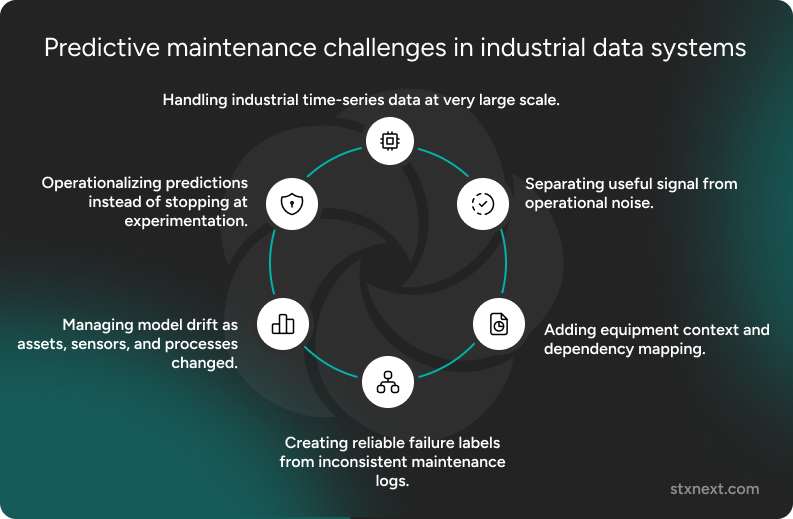
In this project, the biggest predictive maintenance challenges were:
- handling industrial time-series data at very large scale,
- separating useful signal from operational noise,
- adding equipment context and dependency mapping,
- creating reliable failure labels from inconsistent maintenance logs,
- managing model drift as assets, sensors, and processes changed,
- operationalizing predictions instead of stopping at experimentation.
Each of these challenges had a direct impact on whether the system could produce predictions that operators would actually trust and use.
Challenge 1: Extracting predictive signal from high-volume sensor data
The problem was… 10 billion records of noise.
The client had no shortage of data. They had approximately 10 billion records of sensor readings: minute-by-minute measurements from thousands of sensors across multiple facilities, collected over years of operation.
On paper, that sounds ideal for predictive maintenance, right? In reality, raw sensor volume is not the same as predictive value.
Our goal was straightforward: predict equipment failures before they happen, so maintenance could be scheduled based on actual need rather than fixed intervals. Classic.
In practice, those 10 billion raw sensor readings were not useful for prediction.
Temperature, pressure, vibration, and other readings do not mean much on their own. Is this temperature spike a sign of failure, or did the operator just switch to a different production mode? Are these vibrations abnormal, or is the equipment running a scheduled stress test? Without context, raw telemetry becomes noise rather than signal.
This is one of the most common predictive maintenance challenges: teams assume that if enough sensor data exists, prediction is mostly a modeling task. In practice, the first challenge is making that data analytically usable.
And turning noise into a signal required serious infrastructure.
Azure Data Explorer: Choosing the right foundation for large-scale time-series data
For time-series data at this scale, you need a database built specifically for high-volume telemetry workloads. We used Azure Data Explorer (ADX) with Kusto Query Language.
Why ADX? Three reasons:
First, it handled high-frequency ingestion efficiently. Thousands of sensors were reporting continuously every minute. The platform needed to support fast ingestion without turning data collection into a bottleneck. ADX handles high-frequency streaming ingestion without breaking a sweat. That’s exactly what you need when thousands of sensors are reporting every minute.
Second, it provided fast analytical queries across massive datasets. Operations such as time-window filtering, aggregation, rolling statistics, and historical comparisons had to run quickly enough to support exploration and feature engineering. Running analytical queries across billions of records is where traditional databases choke. ADX is built for this. Aggregating minute-level data to hourly intervals, calculating rolling statistics, filtering by time windows. Operations that would take hours elsewhere run in seconds.
Third, it supported cost-effective historical storage. Predictive maintenance requires historical data. You need years of readings to understand rare failure patterns. ADX lets you store everything without the "should we delete old data?" conversations that kill projects later.
We aggregated minute-level sensor readings into hourly intervals, which significantly reduced data volume while preserving the patterns that mattered for the failure modes we were targeting. This was not just a storage optimization. It was a modeling decision. Hourly granularity turned out to be more aligned with real equipment behavior than raw minute-by-minute noise.
Challenge 2: Capturing equipment relationships and dependencies
Here's something most predictive maintenance projects miss: equipment doesn't fail in isolation.
In industrial environments, failures often emerge through relationships. A pump may begin showing abnormal behavior because of upstream pressure instability. A motor overheating event may trace back to a cooling problem several components away. If the model sees only isolated sensor values, it misses part of the causal picture.
This is a major predictive maintenance challenge that is often underappreciated. Many projects focus on per-asset sensor analysis but ignore the structure of the wider system.
How Neo4j helped us model equipment relationships
To capture equipment relationships, we used Neo4j to build a graph model of the equipment hierarchy and dependencies.
This gave us a digital representation of how components, sensors, and assets were connected. That graph structure became valuable in several ways.
It improved contextual analysis thanks to the Digital Twin representation. Every piece of equipment, every sensor, every connection was modeled as nodes and relationships. When a sensor reports anomalous readings, we can instantly see what's connected and what might be affected.
It also supported failure propagation analysis. Graph queries let us trace potential failure chains. If component A shows early warning signs, what downstream equipment is at risk?
It also enriched feature engineering for ML by giving context. The graph structure became input for our models. Features like "distance from last maintenance event" or "number of connected components showing anomalies" dramatically improved prediction accuracy.
This mattered because predictive maintenance does not happen in a vacuum. The closer the data representation gets to the physical and operational reality of the plant, the more meaningful the predictions become.
From experimentation to production: Python + Azure ML
Once we had the data foundation and equipment context in place, the next question was how to experiment quickly without building production complexity too early.
Our data science team lives in Python. Forcing them into Spark or other big-data frameworks too early would have slowed everything down and made experimentation harder than it needed to be.
We kept the stack practical.
We used scikit-learn and PyTorch for model development. These are standard, well-understood libraries that made it easy to test different approaches and iterate quickly. We explored multiple options before settling on ensemble methods that gave us the right balance between accuracy and interpretability.
For time-series forecasting, we also used Nixtla. Predicting remaining useful life (RUL) calls for more specialized methods, and Nixtla gave us strong forecasting capabilities without the need to build everything from scratch.
Once the models were validated, Azure ML handled the production side: model versioning, endpoint deployment, and monitoring. That gave us a practical split between experimentation and operationalization. Local resources supported fast iteration, while the cloud environment supported reliability in production.
The key was not forcing scale too early. Data scientists could work on samples locally, validate ideas quickly, and move to the full dataset only once the approach had proved itself.
But even with the right stack and a sensible workflow, one of the hardest parts of the project was still ahead of us.
Challenge 3: Creating reliable failure labels from messy maintenance logs
Why maintenance logs are rarely ready for ML
This is where most predictive maintenance projects quietly die.
Machine learning needs labeled data. In predictive maintenance, that means clear records of failures: when they happened, what kind of issue occurred, and what actually caused it.
In reality, maintenance logs are usually a mess.
One technician writes "bearing replaced." Another writes "pump serviced." Someone else logs nothing at all because they were busy fixing the problem at 3 AM. Different shifts use different terminology. Sometimes "preventive replacement" looks identical to "failure" in the data.
This is one of the least glamorous parts of predictive maintenance, and one of the most important. If the failure history is inconsistent, incomplete, or ambiguous, the model does not learn equipment behavior. It learns documentation habits.
We spent significant time working with maintenance teams to build a consistent labeling taxonomy. That meant agreeing on what counted as a failure, what counted as preventive intervention, and how to interpret unclear historical records in a way that was still useful for modeling.
It was slow, detailed work. But without it, the model would have been trained on unreliable ground truth.
In predictive maintenance, labeling is not a quick data preparation step. It is a core part of the system design. If teams underestimate it, the model may look technically sound while learning from the wrong signals.
Lesson learned: Budget time for labeling. It's not a data preparation step you can rush through. It's half the project.
Challenge 4: Keeping predictions reliable as equipment and processes change
Even a good model would not stay reliable forever
Even a good predictive maintenance model will not stay reliable forever.
Equipment ages. A three-year-old pump behaves differently than a new one. Sensors drift. A temperature reading might be off by a few degrees after a year of operation. Processes change too: new products, different operating conditions, changing usage patterns.
That means a model that works well today may become less trustworthy months later, even if nothing appears to have “broken” in the system.
This is why drift has to be part of the design from the start.
We built drift monitoring into the system from day one. Not as an afterthought, but as core functionality. That included:
- Statistical monitoring of input distributions
- Automated alerts when data patterns shift beyond thresholds
- Scheduled retraining pipelines, not "we'll retrain when accuracy drops"
Predictive maintenance systems require their own maintenance. Plan for it.
By the end, it was no longer just a model
What came out of this work was a prediction system designed to make predictive maintenance usable in practice.
The system included:
- feature engineering pipelines that transformed raw sensor data into meaningful inputs,
- integration with ADX for scalable time-series storage and querying,
graph-based context from Neo4j for equipment relationships, - RUL predictions that helped operators understand when equipment actually needed attention,
- validation and monitoring frameworks to catch drift and degradation early.
In practical terms, this moved the client away from fixed maintenance schedules and toward a more condition-based approach. That meant fewer unnecessary interventions, fewer surprise failures, and lower operational costs.
Summary: Common predictive maintenance challenges in practice
This case came from one industrial environment, but the patterns behind it are broader. Across predictive maintenance projects, the same challenges tend to show up again and again, even if the assets, processes, or data platforms differ.
What this project changed in how we think about predictive maintenance
It made one thing very clear: predictive maintenance starts to break down early, when the data is hard to use, the asset context is missing, the failure history is inconsistent, and no one has planned for the system to change after deployment.
The model was only one part of the work. Most of the effort went into everything around it: ingesting data at scale, making that data usable, adding equipment context, cleaning and structuring labels, and designing for drift from the beginning.
That is why so many predictive maintenance initiatives struggle. Because turning raw industrial data into predictions that people can trust takes far more than model selection.
Teams that start with “what algorithm should we use?” are usually starting in the wrong place. A better place to begin is with questions like:
- Do we have data at the right granularity?
- Can we connect sensor behavior to maintenance history and equipment context?
- Are our failure labels consistent enough to support learning?
- Do we have a way to monitor whether predictions stay reliable over time?
If the answer to those questions is weak, even a promising model will struggle to create value. If the foundation is strong, predictive maintenance becomes much more than an experiment. It becomes something the business can actually use.
Working on predictive maintenance? Struggling with a stalled initiative? We've been through the hard parts – the data architecture, the labeling nightmares, the drift monitoring. Let's talk about what's blocking your project.


