
Most predictive maintenance projects don't fail at the model, they fail upstream. The sensors aren't there. The network can't carry the data. OEM systems don't talk to each other. OSI Pi is reserved for the three highest-value sites.
And if you somehow get all of it to work, once the operator asks "why?" - you need to have an answer they can trust and act on.
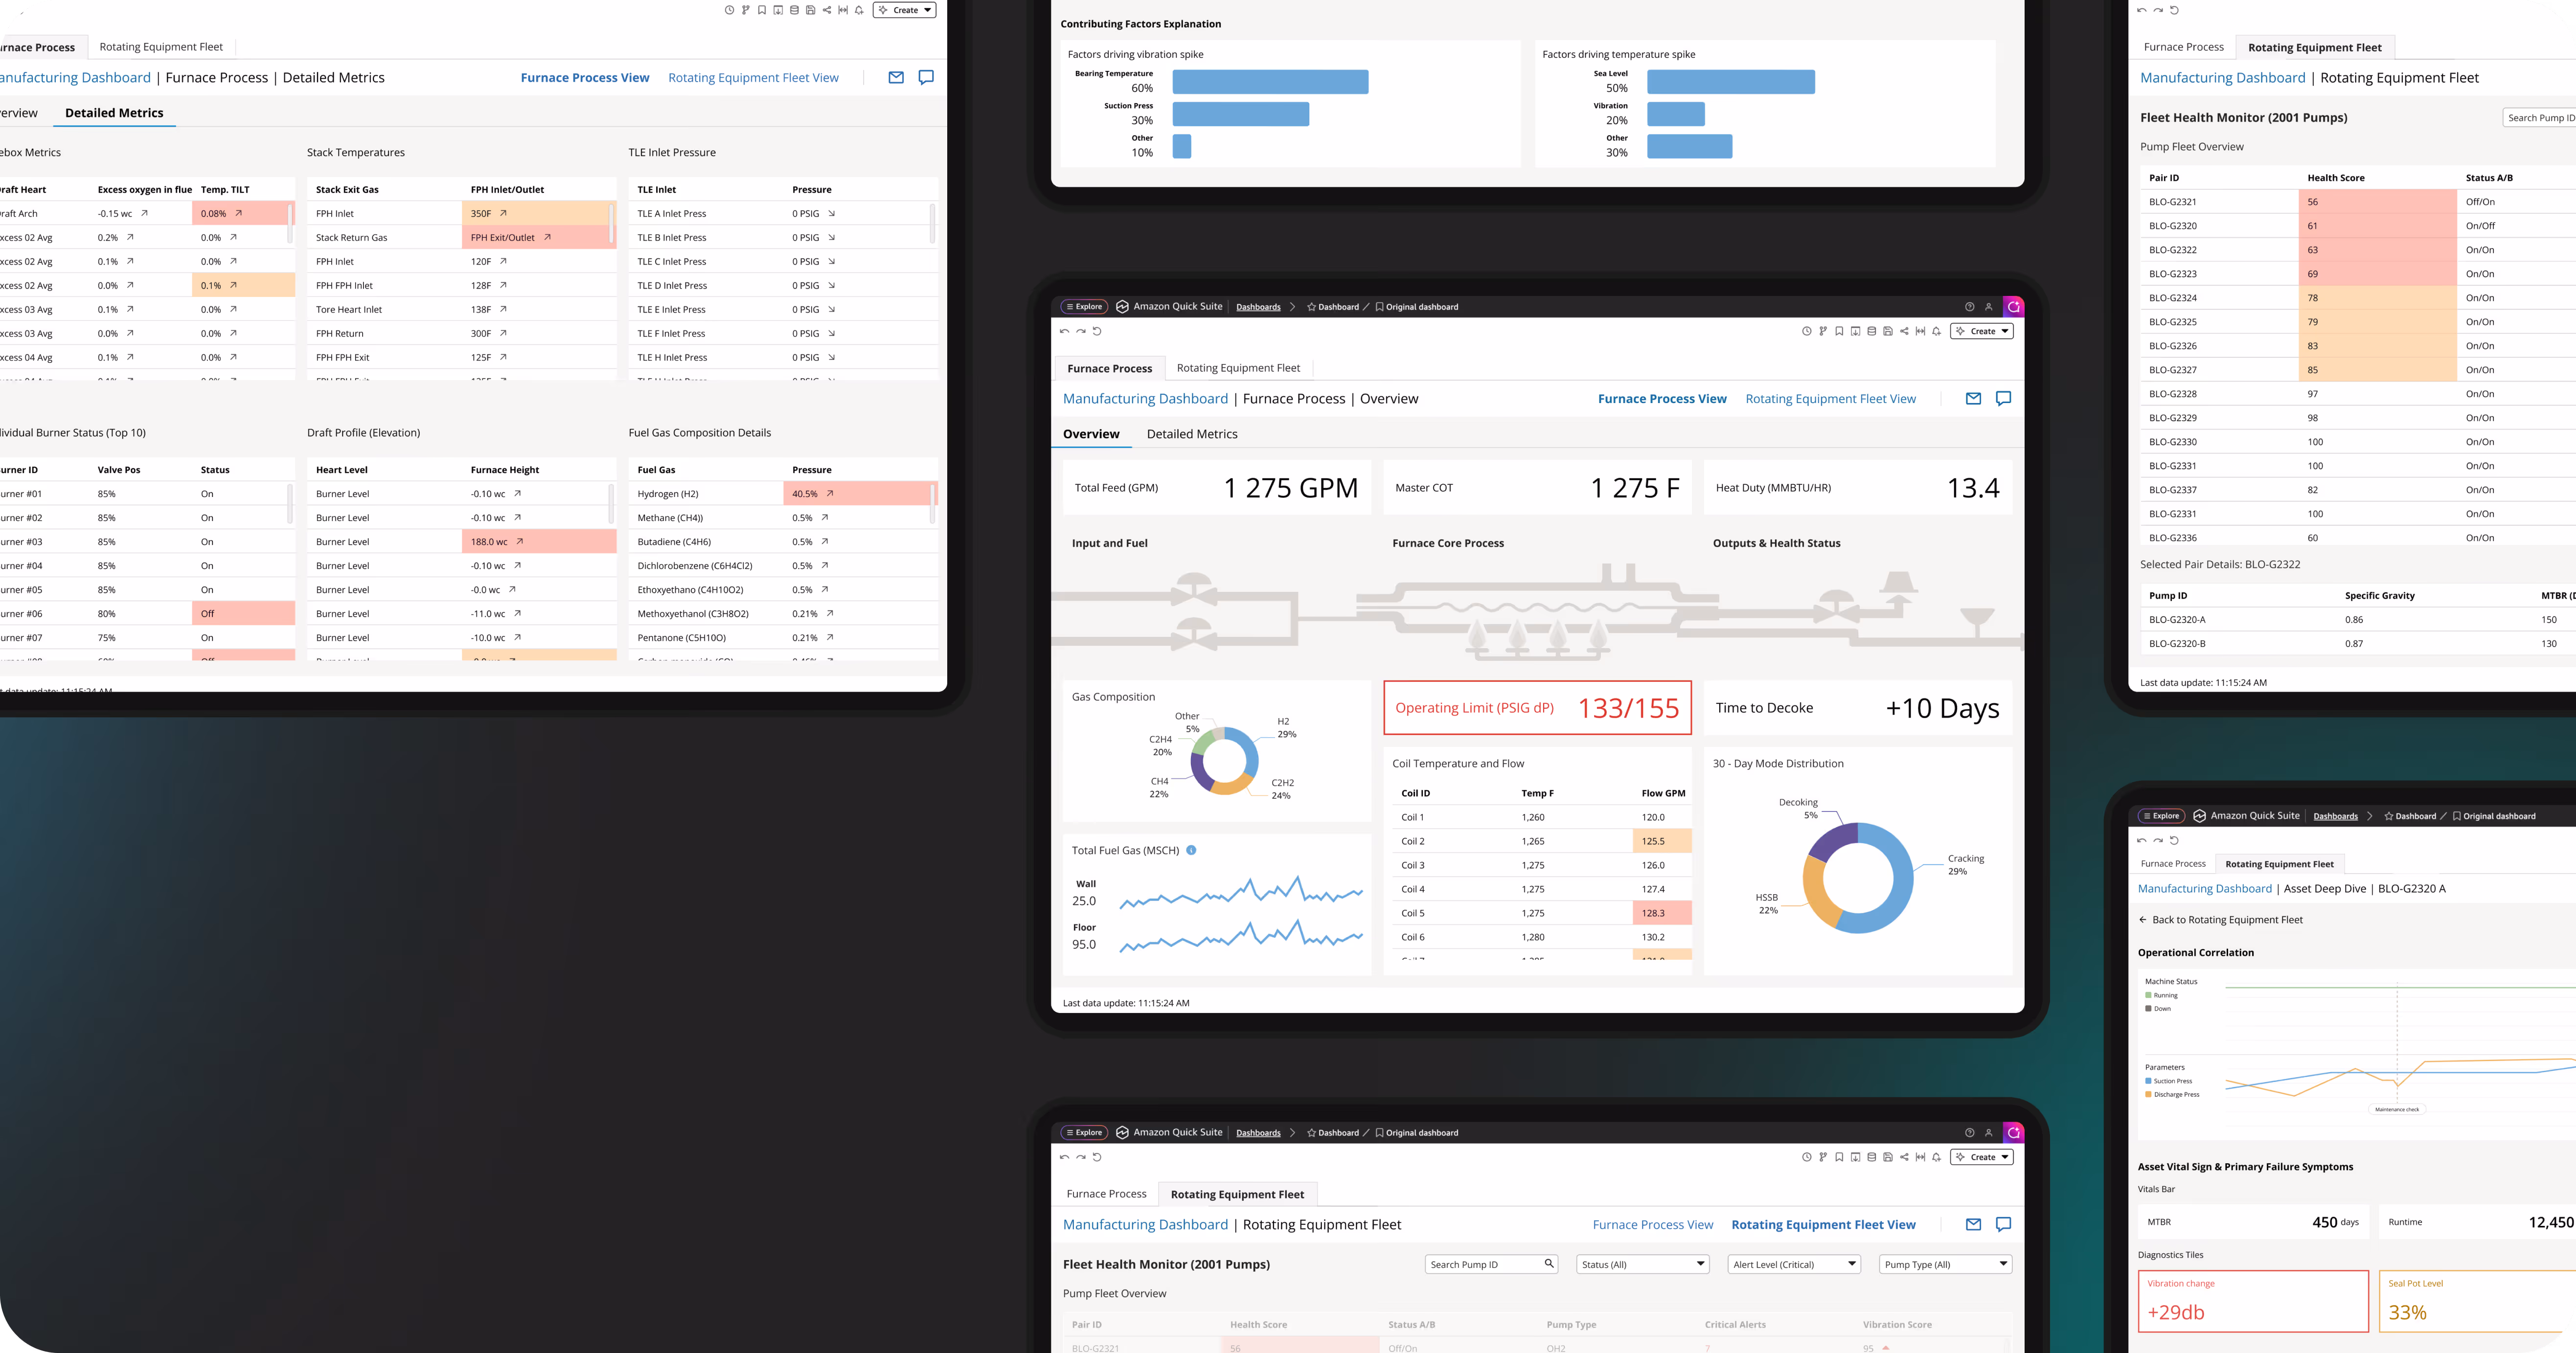
STX Next builds the full chain: sensor and connectivity strategy where coverage is thin, soft sensors and causal digital twins where direct measurement isn't safe, and operator dashboards in QuickSight, Power BI, or whatever your stack already uses. Brownfield-first, vendor-agnostic, end to end.


The barriers aren't algorithmic. They're structural, and most off-the-shelf approaches don't touch them.
Many sites, especially older or mid-value assets, never had the sensor coverage, network bandwidth, or edge infrastructure to make condition monitoring viable. ML can't fix what isn't being measured.
Some equipment manufacturers ship predictive features, but they're legacy, non-cloud-native, and siloed. In a mixed-vendor fleet, which is most fleets, they actively prevent the cross-asset visibility you need.
OSI Pi is the industry's gold-standard historian and it works. But licensing is so expensive that most companies deploy it only at flagship sites, leaving the rest of the asset base without proper data infrastructure.
A growing portion of the market has quietly deprioritized predictive maintenance, hoping AI breakthroughs will close the data gaps. They won't. The data gap is the problem.
The way through isn't a closed platform. It's a services-led, vendor-agnostic build that meets each site where it actually is.
Operator-facing interfaces designed for high-stakes, high-noise environments, rendered in QuickSight, Power BI, or whatever your stack already uses.
Alarmed units elevated; redundant OK indicators removed so anomalies stand out.
Synchronized master-detail interface, allowing granular investigation without losing context.
Correlation charts paired with primary symptom metrics and historical context.
Contributing factors and work-order history surface the next step on the same screen.


Non-negotiable role beside the data engineer and ML engineer. Translates physics into features and keeps models grounded in causation, not correlation.
Predict the unmeasurable: internal chamber temperatures, valve states, internal stress, inferred from boundary signals. Built for the network reality: edge-resident inference where connectivity is degraded or intermittent, cloud-resident where it isn't.
A virtual replica of the asset that behaves like the real thing, not abstract predictions, but how performance shifts over time, in ways your operators can trust and verify.
Heavy models train and live in the cloud. Distilled, quantized variants run at the edge so latency-sensitive decisions stay local, without losing the reasoning.
DMAIC, not deployment templates. Predictive maintenance is closer to a process improvement effort than a software rollout. Define, measure, analyze before modeling.
A brilliant algorithm no one trusts is useless. We design dashboards (QuickSight, Power BI, or your historian's native UI) with strict hierarchy, with color reserved for leading indicators so the eye lands on intervention areas instantly.
If you've already weighed historians, OEM bundles, and closed AI platforms, here's where we fit.
We sit alongside OSI Pi where you have it, and we replace its function at the non-flagship sites where licensing makes Pi unviable. Same data discipline, fraction of the footprint.
Built to work across mixed-vendor fleets. Models train on whatever signals are available: Siemens controllers, ABB drives, third-party retrofits, all of it. Vendor silos stop at our integration layer.
You own the code, the trained models, the pipelines, and the dashboards. Hire any engineering team to maintain it. Reuse in your next deployment. No per-asset licensing that scales against your fleet.
Each industry has its own sensor constraints and its own variables that resist direct measurement.
Plant-wide ML on vibration, temperature, pressure, and operator context across motors, pumps, polymer reactors, extruders, plastic film lines, bottling and packaging. Where soft sensors earn their keep:
Brownfield SCADA + CMMS integration, hazardous-area sensor retrofit, image-based inspection of pipelines and combustion chambers. Estimation of unmeasured internal conditions from boundary data.
Combined heat & power optimization across gas, coal, and storage. Wind turbine condition monitoring. Sustained-efficiency operations that cut emissions by preventing inefficient run states, not retrofitting after damage.
Pre-flight sensor zeroing, image-based crack propagation tracking with sequential photos, and remaining-useful-life models that distinguish stable-stress fractures from real risk.
High-temperature reactors, mining hydraulics, foundries; environments where the most important variable is the one you can't put a sensor on. Soft sensors and physics-aware twins fill the gap.
The real problem is rarely the one that management names. We start with the failure mode, not the technology.
TOPS-8D framing. Map the actual failure mode before any sensors, models, or dashboards enter the conversation.
Audit sensor coverage, fault history, OT integration paths. We tell you if you're not ready and what to fix first.
We pilot at a representative site with engaged operators; not your worst asset. Value proven where buy-in already exists scales across the fleet faster than value forced at the hardest case.
Causal feature engineering, redundancy elimination, explainable models. Every prediction comes with a "what, how, and why" the floor accepts.
Surgical UX layered on top: alarm prioritization, master-detail navigation, work-order integration. Built for the operator on shift, not a control-room analyst after the fact.
One line, then plant, then fleet. Field teams own the system. Models retrain on operator feedback. Documentation and pipelines hand over cleanly.
Predictive maintenance is closer to a Six Sigma effort than a software rollout. Many companies start with tools and algorithms instead of beginning with the process. In manufacturing, that approach backfires.
.avif)
Schedule a chat with Head of AI and one of our senior engineers to discuss your predictive maintenance development needs.


ul. Mostowa 38
61-854 Poznań
Poland
C.11 310 Col. Santa Gertrudis Copo
Merida, 97305
Mexico
10 York Rd
London SE1 7ND
United Kingdom
c/o Rödl RAe, Taunus Tower, Mergenthalerallee 73-75
65760 Eschborn
Germany
City Place 1401 Lake Plaza Dr, Ste. 200
Spring, TX 77389
United States


