


Intro
Connecting machine data with production, quality, and maintenance records is where most manufacturing data projects stall. An industrial data lakehouse addresses it by linking operational technology (OT) data from machines, sensors, programmable logic controllers (PLCs), and supervisory control and data acquisition (SCADA) systems with IT data from manufacturing execution systems (MES), enterprise resource planning (ERP), quality, and maintenance systems.
Those sources become much more useful when they share the same asset, time, and production context. A sensor reading, for example, can be connected to the machine that produced it, the batch or production order running at the time, and the operating conditions around it.
This gives manufacturers a reusable data foundation for root-cause analysis, predictive maintenance, quality analysis, production optimization, reporting, and scaling analytics across plants.
In this architecture, the lakehouse provides the shared analytical data foundation: scalable storage combined with governed table structures, processing, and access for reporting, analytics, and AI.
A useful manufacturing data foundation should provide several core capabilities:
- A common asset model: consistent identities and relationships across plants, areas, lines, machines, components, and sensors.
- A shared time model: aligned events and measurements that make it possible to reconstruct production activity across systems.
- Production context: clear links between machine activity and products, batches, orders, recipes, operations, shifts, and production states.
- Consistent business definitions: shared, governed definitions for KPIs and operational concepts across plants and applications.
- Traceability: data relationships that make it possible to trace business outcomes back to the production conditions that contributed to them.
- Governance and ownership: clearly assigned responsibility for data quality, definitions, access, and lifecycle management.
These capabilities turn the lakehouse from a passive repository into a shared data foundation for operational decision-making.
What manufacturers gain from an industrial data lakehouse
Bringing operational and business data into the same context makes it easier to use that data consistently across teams, plants, and applications.
- Faster root-cause analysis: time-aligned machine, production, maintenance, and quality data reduces the manual work required to reconstruct what happened around a downtime or quality event.
- Consistent operational metrics: shared data models and governed definitions give plants the same basis for metrics such as overall equipment effectiveness (OEE), mean time between failures (MTBF), scrap, and energy consumption per unit.
- A stronger foundation for AI and advanced analytics: contextualized historical data can support predictive maintenance, predictive quality, production optimization, and other models without rebuilding the underlying integrations for every use case.
- More reuse across plants: common asset, time, and production models allow the same data structures and analytical logic to be extended to additional lines and facilities.
Industrial data architecture: five layers
Traditional data warehouses and data lakes can address parts of the manufacturing data problem, but telemetry, production context, and analytical logic often remain disconnected. An industrial data lakehouse brings these elements together without replacing the systems that generate and manage operational data. It provides a foundation for processing, contextualizing, and reusing data across analytics and AI applications.
A typical industrial data lakehouse architecture can be organized into five layers:
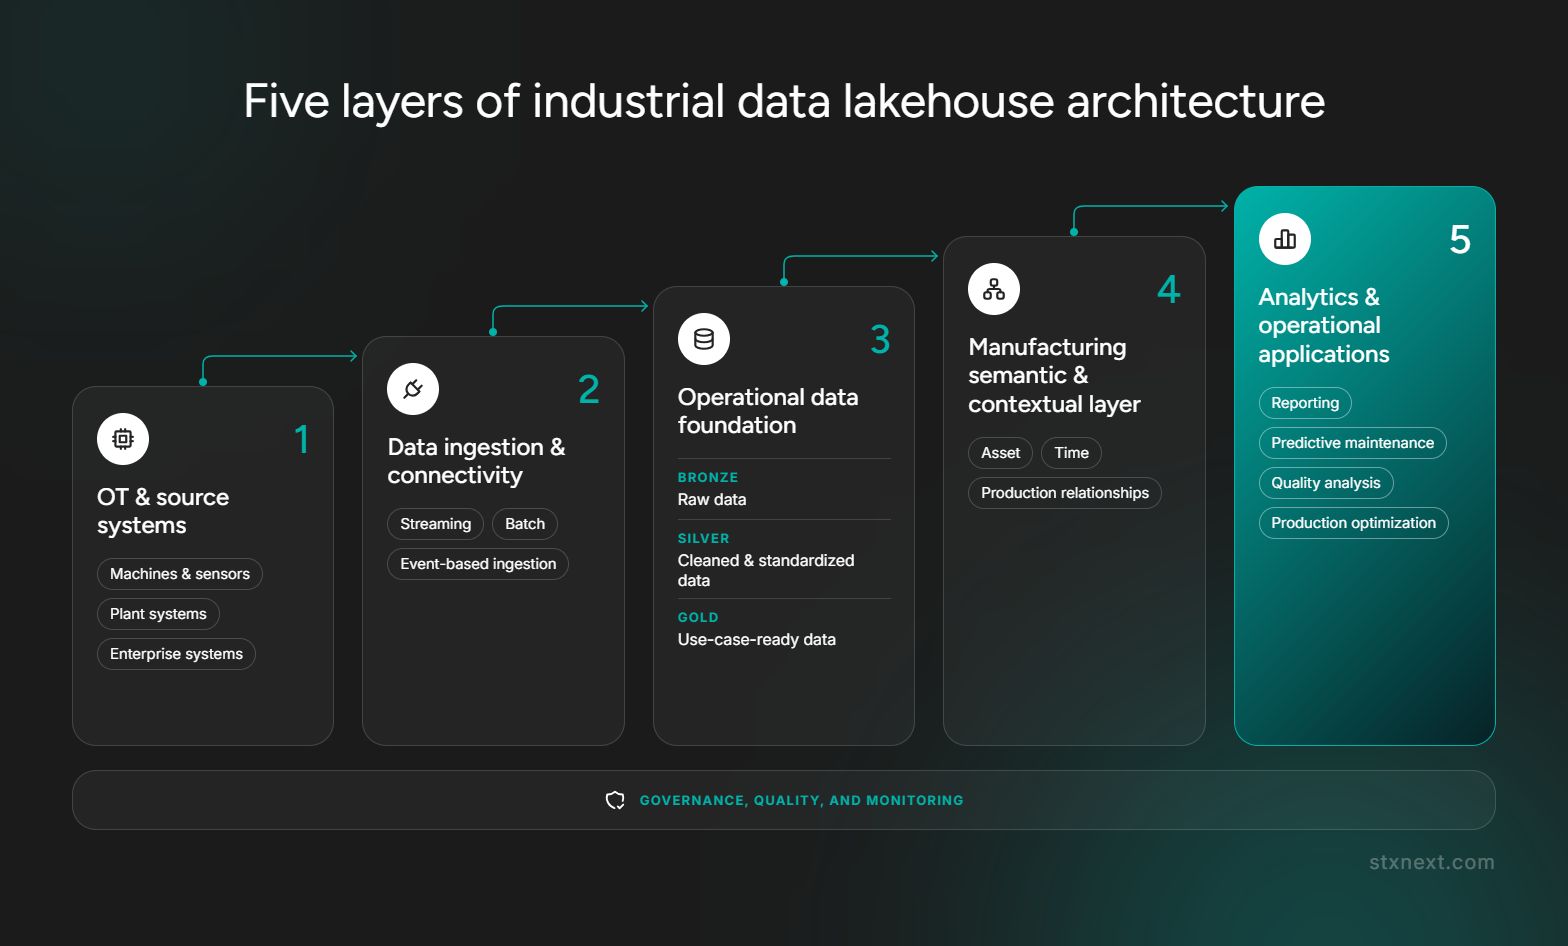
1. OT and source systems
Machines, PLCs, SCADA systems, historians, MES, QMS, CMMS, ERP, laboratory systems, and other plant applications remain the systems that generate or own operational data. Together, these sources provide machine-level signals as well as the production, maintenance, quality, and business context needed to interpret them.
Edge gateways collect and forward telemetry from equipment where direct connectivity to the central platform is impractical.
2. Ingestion and connectivity
Data is collected through appropriate interfaces for each source. Streaming or near-real-time ingestion can be used for high-frequency machine signals, while batch or event-based ingestion can be appropriate for transactional systems.
For example, MQTT is commonly used to publish machine and sensor data from equipment or edge gateways to a messaging layer. Kafka, Azure Event Hubs, or similar services can then support larger event streams, while Change Data Capture (CDC) records changes in systems such as MES and ERP without repeatedly copying entire data sets.
Machine control remains within the OT or edge environment. The lakehouse consumes operational data for analytics, monitoring, and decision support, but it does not replace the systems responsible for real-time control or safety-critical operation.
Industrial pipelines also need to preserve event time and account for delayed, duplicated, or replayed records. After ingestion, data is cleaned, deduplicated, time-aligned, and enriched. Processing engines such as Apache Spark or Flink handle these transformations and connect OT events with production context from systems such as MES.
3. Operational data foundation
Raw and standardized data is stored with metadata that preserves its source, timing, asset identity, and production relationships. This is the core lakehouse data foundation from which multiple downstream use cases are developed.
A medallion architecture organizes the data into three stages:
- Bronze: raw machine, sensor, historian, and source-system data.
- Silver: cleaned and standardized data with aligned timestamps, consistent units, duplicates resolved, and records mapped to the relevant assets.
- Gold: datasets prepared for specific business and operational uses, such as OEE, MTBF, scrap analysis, energy monitoring, or predictive maintenance.
Across these layers, the platform also has to support reliable processing and traceability. For sensor and event data, that includes replay and backfills, freshness checks, missing-data detection, lineage, and a clear distinction between a genuine zero reading and no signal at all.
Open table formats such as Apache Iceberg and Delta Lake support schema evolution and historical versions as source systems and data structures change.
Case study: See the medallion architecture in practice
AgroSieć, an agricultural machinery company, built a production-grade Microsoft Fabric platform using Bronze, Silver, and Gold layers across 218 dbt models and 110 source tables. Raw data enters the Bronze layer, is cleaned and standardized in Silver, and is transformed into business-ready models in Gold. The modular structure also allows new sources and analytics products to be added without redesigning the platform.
See how AgroSieć implemented its lakehouse architecture →
4. Manufacturing semantic and contextual layer
The semantic and contextual layer uses the governed data in the lakehouse to establish consistent relationships between assets, production orders, batches, materials, processes, quality events, maintenance activities, and time. It gives otherwise disconnected OT and IT records a consistent manufacturing context that downstream applications can reuse.
Asset identities, timestamps, and production references established here can then be reused across analytics and applications rather than reconstructed separately for each use case.
5. Analytics and operational applications
BI dashboards, advanced analytics, AI and machine-learning models, engineering applications, quality analysis, maintenance use cases, and operational decision-support tools consume the governed data foundation.
The same asset, time, and production context can support downtime investigation, quality analysis, predictive maintenance, production optimization, and reporting without rebuilding the underlying data relationships for each application.
This architecture separates data collection from analytical logic while keeping the operational context reusable.
Industrial example: processing telemetry at multi-factory scale
A global chemical manufacturer built a real-time data platform that processes around 100 million telemetry records per day across 11 factories. Azure Event Hubs ingests the incoming telemetry, Azure Data Explorer supports aggregation and analysis, and Power BI gives production teams near-real-time visibility into factory performance.
The platform also created a foundation for predictive maintenance and other advanced analytics. Read the full chemical manufacturing data platform case study.
This type of architecture provides a reusable foundation for adding new data sources, use cases, and plants over time. Our data lakehouse consulting services cover architecture design, data integration, medallion-layer implementation, semantic modeling, and scaling the platform into production.
Where Databricks and Snowflake fit
Databricks and Snowflake can both cover several parts of a lakehouse architecture. Databricks is commonly used for large-scale data processing, streaming, data engineering, and machine-learning workloads, while Snowflake is widely used for governed SQL analytics, BI, and enterprise reporting. The right choice depends less on the lakehouse label itself and more on workload characteristics, latency requirements, existing skills, governance needs, deployment constraints, and the surrounding technology estate.
Open table formats such as Apache Iceberg also support architectures where several engines need to work with the same underlying data rather than maintaining separate analytical copies.
Our Databricks consulting services and Snowflake consulting services cover these implementation patterns.
The importance of a common manufacturing semantic model
A manufacturing semantic model defines how assets, production activity, materials, quality, maintenance, and time relate to one another in the lakehouse. It gives records from different OT and IT systems a consistent identity and structure that can be reused across downstream applications.
Each machine needs a persistent identity and clear relationships to the plant, line, process, components, and sensors around it. That identity also has to work across systems. The same physical machine may have different identifiers in SCADA, MES, ERP, and CMMS, so a stable enterprise asset ID can link those source-system records to the same asset.
Production orders also need consistent references to products, materials, operations, equipment, batches, and quality results.
A simplified operational model might connect:
Plant → Area → Line → Machine → Component → Sensor
with:
Production Order → Product → Batch/Lot → Operation → Process Parameters
and:
Material Lot → Supplier → Machine/Process → Quality Result
while maintenance events, downtime events, and operator or shift context are associated with the relevant assets and production windows.
This brings together three types of context:
- Asset context: which machine, component, or sensor produced the data.
- Time context: when the event happened and which machine state, shift, or production window it belongs to.
- Production context: which order, batch, product, material, or operation was active at that time.

For example, a sensor record can carry a reference to the machine and component that produced it, while its timestamp connects it to the production order and batch active at that moment. Maintenance and quality records can then use the same asset and production identifiers. The relationships are established in the shared model rather than recreated separately in each dashboard, analysis, or machine-learning pipeline.
Those relationships also have to remain historically accurate. Machines may be renamed or reassigned to different lines, sensors may be replaced, and asset hierarchies may change over time. The model therefore keeps historical mappings so an event can still be interpreted against the equipment and production structure that existed when it occurred.
Case study: See connected manufacturing data in practice
A global chemical manufacturer needed to improve how it planned furnace cleaning. Live process data from the plant historian was combined with equipment condition, maintenance windows, production targets, and site constraints to determine when each unit should be taken offline. After rollout at the first site, the manufacturer recorded approximately 15% more effective operating time.
See how connected process and maintenance data improved furnace cleaning decisions →
The exact model will vary by industry, but the principle remains the same: relationships should be modeled once and reused across use cases.
Without this semantic layer, every analytical project tends to recreate its own interpretation of assets, production periods, and business definitions.
Industrial data lakehouse use cases: from analysis to operational decisions
Once OT and IT data is connected through a common context model, the same lakehouse foundation can support multiple operational use cases. Root-cause analysis, predictive maintenance, quality analysis, and production optimization draw on the same governed asset, time, production, maintenance, material, and quality data rather than requiring a separate data foundation for each application.
Root-cause analysis: why did the line stop?
An engineer investigating a downtime event can reconstruct what was happening before and during the stoppage. Machine states, alarms, pressure or temperature readings can be viewed alongside the production order, shift, material lot, and maintenance history.
This creates a synchronized event history that helps teams identify the conditions surrounding the failure without manually joining data from several systems.
Predictive maintenance: when should equipment be serviced?
Historical equipment signals can be combined with maintenance interventions and operating conditions to identify patterns that precede failures. This helps distinguish genuine signs of degradation from changes caused by normal operating conditions.
The resulting models can estimate equipment health, flag abnormal behavior, or indicate when maintenance should be planned. Their outputs can then feed maintenance schedules, inspection priorities, or alerts used by engineering teams.
Predictive quality: which process conditions contribute to defects?
Quality outcomes can be connected to the exact process conditions under which a product was manufactured. This enables models to identify combinations of parameters associated with defects and process drift.
Sensor readings, machine states, process settings, batch information, and material data can be analyzed alongside quality results to show which conditions are repeatedly associated with defects. Teams can then investigate those conditions earlier and adjust the process before more defective output is produced.
Production optimization: which conditions produce the best results?
Production performance can be evaluated against product, recipe, machine, shift, material, and operating conditions. This allows organizations to compare performance across runs and identify repeatable operating conditions.
Teams can identify which combinations of process settings and production conditions consistently deliver better yield, cycle time, or throughput. Those operating windows then inform production settings and planning.
Supply and material analysis: are incoming materials affecting production?
Material lots and supplier information can be connected to production and quality outcomes. Organizations can therefore investigate whether changes in incoming materials correlate with yield, scrap, process stability, or equipment behavior.
The same analysis identifies whether a specific material lot or supplier is repeatedly associated with higher scrap, lower yield, or less stable production, supporting both quality investigations and supplier evaluation.
Enterprise performance analysis: what is the business impact of a shop-floor event?
Operational events can be connected to inventory, cost, delivery commitments, and production plans. This helps translate shop-floor events into business impact and gives operational and business teams a common view of performance.
A line stoppage can be evaluated in terms of lost production, delayed orders, additional maintenance cost, or inventory impact rather than only minutes of downtime.
The important point is that these use cases reuse the same contextual model instead of creating another integration layer each time.
Technical challenges in industrial lakehouse implementations
Industrial pipelines have to handle time alignment, late and replayed data, duplicates, and changing schemas or asset structures.
Time alignment is especially important when machine data, historian records, MES events, and maintenance data use different clocks or arrive at different times. Pipelines need to preserve the original event time so engineers can reconstruct what actually happened before and during a production event.
Late and replayed data is common when edge devices buffer records during a network interruption and transmit them once connectivity returns. Deduplication and idempotent processing prevent those records from being counted twice or distorting production metrics.
Schema and asset changes also need to be handled without breaking downstream models. Sensor replacements, firmware updates, renamed tags, corrected MES records, or changes to machine hierarchies can all affect how historical and current data relates.
For more detail on these mechanisms, see our guide to Apache Iceberg for industrial data platforms.
Governance in an industrial data lakehouse
Centralizing data does not resolve inconsistent ownership, definitions, or quality rules. Governance defines who owns the data, which system is authoritative for each business concept, how quality is measured, and how changes to assets and definitions are managed.
For example, an organization should be able to answer questions such as:
- Which system is authoritative for the production order?
- Which system defines the machine hierarchy?
- How is downtime classified?
- What is the official definition of OEE?
- Who is responsible for correcting an incorrect asset mapping?
- How are renamed machines or replaced sensors represented historically?
- Which users or applications can access detailed production data?
These are operating-model questions as much as they are technical questions.
A useful governance model therefore combines central standards with plant-level ownership. Enterprise teams can establish common definitions, security policies, and architectural standards, while plant and domain experts remain responsible for the operational meaning and quality of their data.
Our data governance consulting services cover areas such as data ownership, quality controls, lineage, access management, and governance processes across the data lifecycle.
Scaling across plants
A lakehouse becomes significantly more valuable when its model can be reused across multiple facilities.
The goal should not be to make every plant identical. Plants may have different equipment, processes, legacy systems, and local requirements. Instead, the architecture should establish a common vocabulary and a consistent set of relationships while allowing plant-specific implementation details where necessary.
The shared model can standardize:
- asset and production hierarchies;
- KPI definitions and calculation logic;
- naming and metadata conventions;
- data quality and access rules;
- reusable pipeline and data-product patterns.
Each plant then maps its local equipment, source systems, and operational details into those shared structures.
If every plant requires a completely separate data model, pipeline set, and KPI implementation, the organization continues to operate a collection of isolated solutions. If the enterprise model is too rigid, however, local operational differences become difficult to represent.
A scalable manufacturing data foundation therefore needs both standardization and extensibility. Common structures make data and logic reusable across facilities, while local extensions preserve the detail needed to represent how each plant actually operates.
Measuring whether the lakehouse is delivering value
The success of a manufacturing lakehouse should ultimately be assessed through operational outcomes, not only technical platform metrics.
Infrastructure indicators such as storage volume, pipeline throughput, or query performance show whether the platform is running efficiently. They do not show whether teams are investigating problems faster, spending less time preparing data, or making better production and maintenance decisions.
Useful indicators include:
Together, these indicators show whether the platform is improving data access and consistency, reducing duplicated work, and contributing to operational results.
Reuse is especially important. If every new use case still requires its own pipelines, definitions, and integrations, the organization has not yet created a genuinely shared data foundation.
The goal is to show whether the lakehouse changes how manufacturing teams work and make decisions, rather than simply increasing the amount of data stored.
A practical path from pilot to scale
A lakehouse implementation doesn't have to start with every plant, system, and data source. It can start with a specific operational need and expand from there.
For example, a manufacturer wants to understand why a packaging line keeps stopping unexpectedly. That gives the team a clear starting point: identify the machines involved, connect the relevant production and maintenance data, and build the context needed to investigate those stoppages.
Once that foundation works, the same asset, time, and production relationships can support other use cases and extend to additional lines and plants.
Phase 1: Establish the foundation
Select a high-value production problem, identify the relevant assets and systems, establish ownership, and define the minimum operational model required to connect the data.
For the packaging-line example, this means identifying the machines involved, the PLC or historian signals that describe their state, the MES records for production orders and shifts, and the maintenance system that records faults and interventions. The first model only needs the asset, time, production, and maintenance relationships required to investigate the stoppages.
Phase 2: Connect the critical context
Integrate the OT signals with the production, maintenance, quality, or material information required for the selected use case. Focus on reliable time alignment and consistent identifiers before expanding scope.
Machine states, alarms, temperatures, speeds, and other relevant signals are aligned with production orders, shifts, downtime records, and maintenance events. Asset IDs and timestamps need to match across systems so engineers can reconstruct what happened before and during each stoppage.
This is also where ingestion rules are defined for late, duplicated, or replayed records so the event history remains reliable.
Phase 3: Standardize reusable models
Turn the successful relationships and KPI definitions into reusable data products or governed models. This reduces the need to rebuild the same logic for every subsequent use case.
For example, the asset hierarchy, downtime definitions, production-order mappings, and machine-state logic created for the packaging line become shared models rather than logic embedded in one analysis or dashboard.
The data can then move from raw records through contextualized datasets to use-case-ready outputs for downtime analysis and reporting.
Phase 4: Expand across use cases
Extend the foundation to additional downtime, quality, maintenance, production, and supply-chain scenarios. Reuse the same asset and production context rather than creating isolated pipelines.
The packaging-line data can now support other questions. Maintenance teams can analyze recurring fault patterns, production teams can compare throughput across shifts and products, and quality teams can investigate whether process conditions around stoppages also correlate with defects.
Each new use case adds only the additional data and logic it needs while reusing the existing asset, time, and production relationships.
Phase 5: Scale across plants
Apply the common model and governance standards to additional facilities while allowing for legitimate differences in equipment, processes, and local systems.
A second plant may use different PLCs, naming conventions, or maintenance software, so its local data needs to be mapped to the shared asset, production, KPI, and governance structures.
Once that mapping is established, the same implementation pattern can be reused across more lines and plants.
Starting with a scoped proof of concept
A first implementation can also be scoped as a proof of concept. Our data lakehouse consulting services include 4–12 week PoCs covering up to 15 entities, a medallion architecture, pipelines, a semantic model, data validation, and sample reporting.
This approach connects technology investment to measurable operational outcomes and reduces the risk of creating another large platform without clear adoption.
Conclusion
The traditional approach to manufacturing data often treats integration as a series of individual projects: connect the historian to a dashboard, connect MES to reporting, create a quality data mart, build a predictive-maintenance pipeline, and repeat the process for the next use case.
This can produce useful results, but it also creates a growing collection of point solutions. An industrial data lakehouse provides a shared operational foundation in which relationships between assets, time, production, maintenance, quality, and business outcomes are modeled once and reused across analytics, applications, and AI.
Its value comes from giving teams a consistent way to understand what happened, where and when it happened, what was being produced, under which conditions, and what the business outcome was.


